



Hang Seng Tech: Improving earnings can't stop the technical breakdown
Hang Seng Tech continues to slide despite improving earnings expectations across many major constituents. With valuations contracting and key technical support broken, the question is whether the selling has further to run.
Share this:

- Hang Seng Tech underperforms despite improving forward earnings expectations
- Median forward valuations contract sharply over the past quarter
- AI capex concerns, higher yields, weak Chinese consumer weigh
- Breakdown below 4,200–4,250 puts further losses in play
While technology indices across much of the developed world have been powering higher, even allowing for some weakness over the past couple of weeks, China's Hang Seng Tech Index has been the polar opposite, extending a prolonged period of underperformance.
The index has fallen nearly 14% over the past three months, with the latest leg lower producing a breakdown through key technical levels.
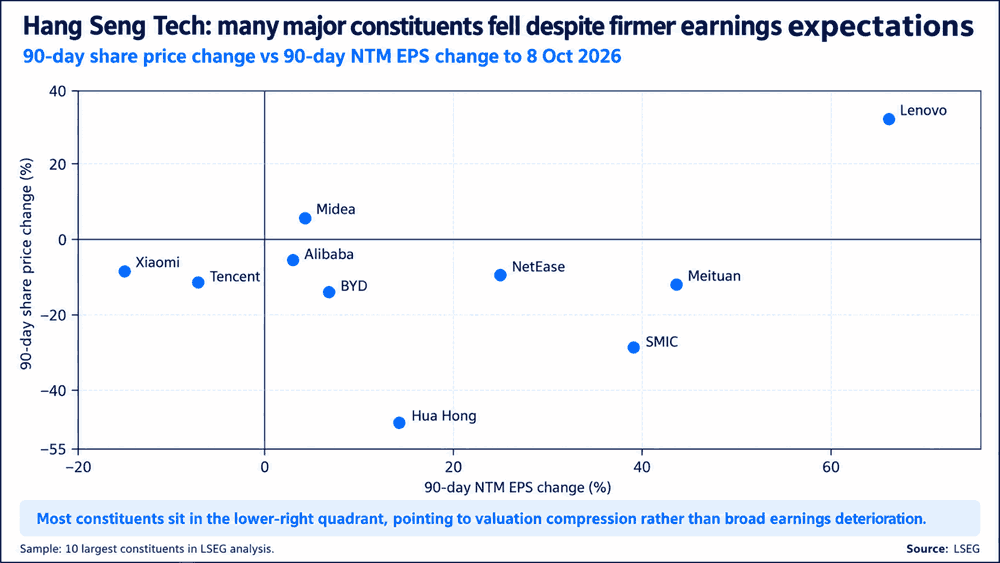
What makes the performance unusual is that the selling has continued despite improving earnings expectations across many of the index's largest constituents. Rather than being driven by a deteriorating profit outlook, the persistent weakness appears to reflect investors becoming increasingly reluctant to pay up for future earnings growth.
That raises two important questions: what's behind the change in sentiment, and what would be needed to turn it around?
Valuations contract despite improving earnings expectations
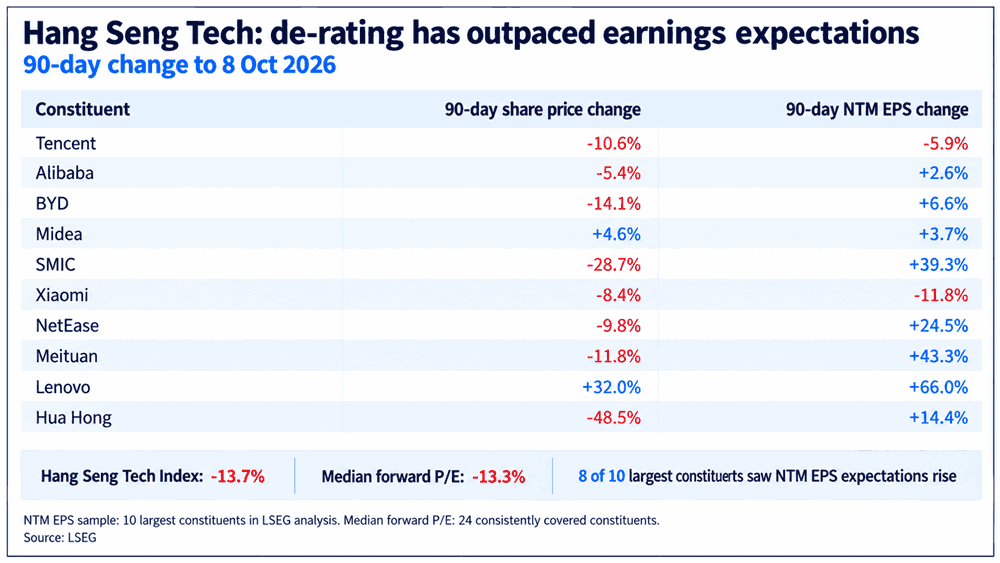
Looking at the table below, it reinforces that Hang Seng Tech's recent decline has occurred at the same time when earnings expectations have generally been improving.
Source: LSEG
Analysis of LSEG data reveals that eight of the ten largest index constituents have seen their expected earnings per share over the coming 12 months increase over the past quarter, yet most of those companies have experienced falling share prices over the same period.
That disconnect is also seen in valuations. Across 24 index constituents that have consistent data to interpret, the median forward price-to-earnings ratio has contracted 13.3%, closely matching the index's 13.7% decline.
While I don't pretend that these figures represent an official index-level earnings measure, they suggest something akin to a buyers' strike is taking place, with investors unwilling to pay up for expected higher earnings in the future.
Source: LSEG
What's behind the buyers' strike?
There are several possible explanations for why investors have become so reluctant to pay for anticipated earnings growth.
One is the growing concern globally about the enormous sums being poured into AI infrastructure and whether that investment will ultimately deliver sufficient returns to justify the spending. Those concerns were reinforced by a Financial Times report on Thursday about OpenAI's annualised revenue, which was enough to trigger broad-based weakness across the US and European technology sectors.
We've also seen a sharp rise in global bond yields, which may be another contributing factor, putting additional pressure on equity valuations, particularly for long-duration companies whose valuations have historically been tied heavily to future earnings growth.
Then, of course, there are China's domestic challenges. Economic growth remains sluggish, particularly in the household sector, where a prolonged property market downturn continues to weigh on consumer confidence and spending. For an index like Hang Seng Tech, which has substantial exposure to consumer-facing internet and technology businesses, there's a clear fundamental connection.
While it's difficult to determine how much each factor has contributed to Hang Seng Tech's underperformance, collectively they provide important context for why investors may be demanding an even greater discount for anticipated earnings growth.
Sellers remain firmly in control
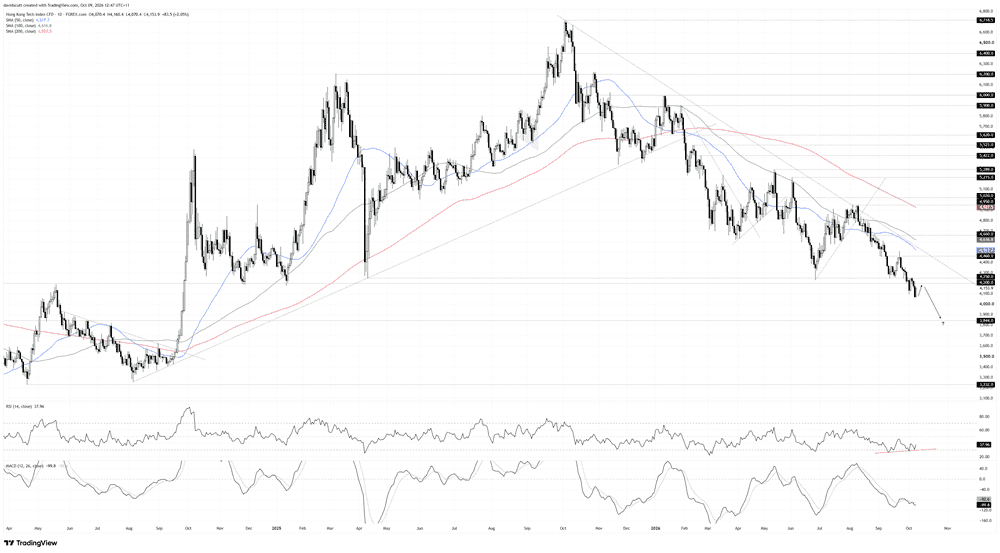
A reversal of the factors discussed above could help turn sentiment around, while an improvement in relations between the US and China may provide another catalyst. However, one look at the technical picture below suggests there's little evidence yet that a meaningful turnaround is on the cards.
Source: TradingView
The index remains in a strong bearish trend, trading beneath its key medium and long-term moving averages, all of which carry a negative slope. The latest leg lower has taken the price to levels not seen since September 2024, breaking beneath a key support zone between 4,200 and 4,250.
The upper end of that zone coincides with the April swing low that sparked a savage rebound, subsequently acting as support on several occasions, particularly over recent months. The lower boundary at 4,200 has acted as both support and resistance at various points dating back to 2023, making the entire zone an important area to watch overhead.
Today's modest rebound has taken the index back towards the lower end of that former support zone, presenting a potential entry point for shorts for those seeking an extension of the prevailing bearish trend. A back test and rejection would bolster the merits of the setup, allowing for a stop to be placed above the resistance zone for protection, with Thursday's low at 4,059.4 back in focus.
Below that, there's something of a vacuum, with little meaningful support evident until 3,844, a level that acted as both support and resistance on numerous occasions during late 2023 and the first half of 2024. That screens as the next downside target.
Both momentum oscillators favour short setups over longs, although there's a cautionary signal emerging. While RSI (14) sits around 35, bullish divergence is developing, suggesting downside pressure may be ebbing rather than building. MACD has yet to confirm that signal, remaining beneath its signal line deep in negative territory.
Of course, we've seen multiple countertrend rallies since the October 2025 highs, meaning a reversal of the latest breakdown cannot be ruled out. Should the price reclaim 4,250 and hold above it, long setups could also be considered, targeting 4,460 initially, a minor level that has acted as both support and resistance over recent months.
Beyond that, the 50-day and 100-day moving averages loom overhead, with downtrend resistance extending from the October 2025 highs sandwiched in between.
Latest market news




Open an account in minutes
Experience award-winning platforms with fast and secure execution.
Economic calendar
Web Trader platform
Our sophisticated web-based platform is packed with features.
Related articles
DXY, GBP/USD, AUD/USD, USD/CAD, USD/JPY, Gold Weekly Technical Outlook 11 16 2026
Sr. Technical Strategist Michael Boutros highlights the levels that matter on the USD Majors, commodities, and equity indices charts this week.

Crude Oil Weekly Outlook: Geopolitics vs Oversupply Risks
Crude Oil Weekly Outlook: The IEA has flagged the risk of an oil supply surplus since the Iran war began. Yet WTI and Brent have held onto bullish rebounds from key support near 84 and 89, respectively, as geopolitical risks persist.


Nikkei swings harder than Nasdaq as AI fears deepen
Nikkei 225 volatility is running well ahead of Nasdaq 100, with the index construction and Japan's heavy exposure to AI manufacturing potentially explaining the difference.
StoneX Financial Ltd (trading as "FOREX.com") is an execution-only service provider. This material, whether or not it states any opinions, is for general information purposes only and it does not take into account your personal circumstances or objectives. This material has been prepared using the thoughts and opinions of the author and these may change. However, FOREX.com does not plan to provide further updates to any material once published and it is not under any obligation to keep this material up to date.
This material is short term in nature and may only relate to facts and circumstances existing at a specific time or day. Nothing in this material is (or should be considered to be) financial, investment, legal, tax or other advice and no reliance should be placed on it. No opinion given in this material constitutes a recommendation by FOREX.com or the author that any particular investment, security, transaction or investment strategy is suitable for any specific person.
The material has not been prepared in accordance with legal requirements designed to promote the independence of investment research. Although FOREX.com is not specifically prevented from dealing before providing this material, FOREX.com does not seek to take advantage of the material prior to its dissemination. This material is not intended for distribution to, or use by, any person in any country or jurisdiction where such distribution or use would be contrary to local law or regulation. For further details see our full non-independent research disclaimer and quarterly summary.