



Index in focus: All eyes on 34K for Dow traders
Why this week’s price action could set the trading bias for US indices heading into September and beyond...
Share this:

After a solid day to start the week, the Dow Jones Industrial Average (Wall Street CFD) is gaining more ground today.
The proximate cause for this morning’s rally comes from the US consumer. Between a solid 11.6% y/y rise in Redbook’s weekly retail sales figure and strong results from both Walmart (WMT +5%) and Home Depot (HD +4%), traders are more confident that economic growth remains on sound footing, despite ongoing inflationary pressures.
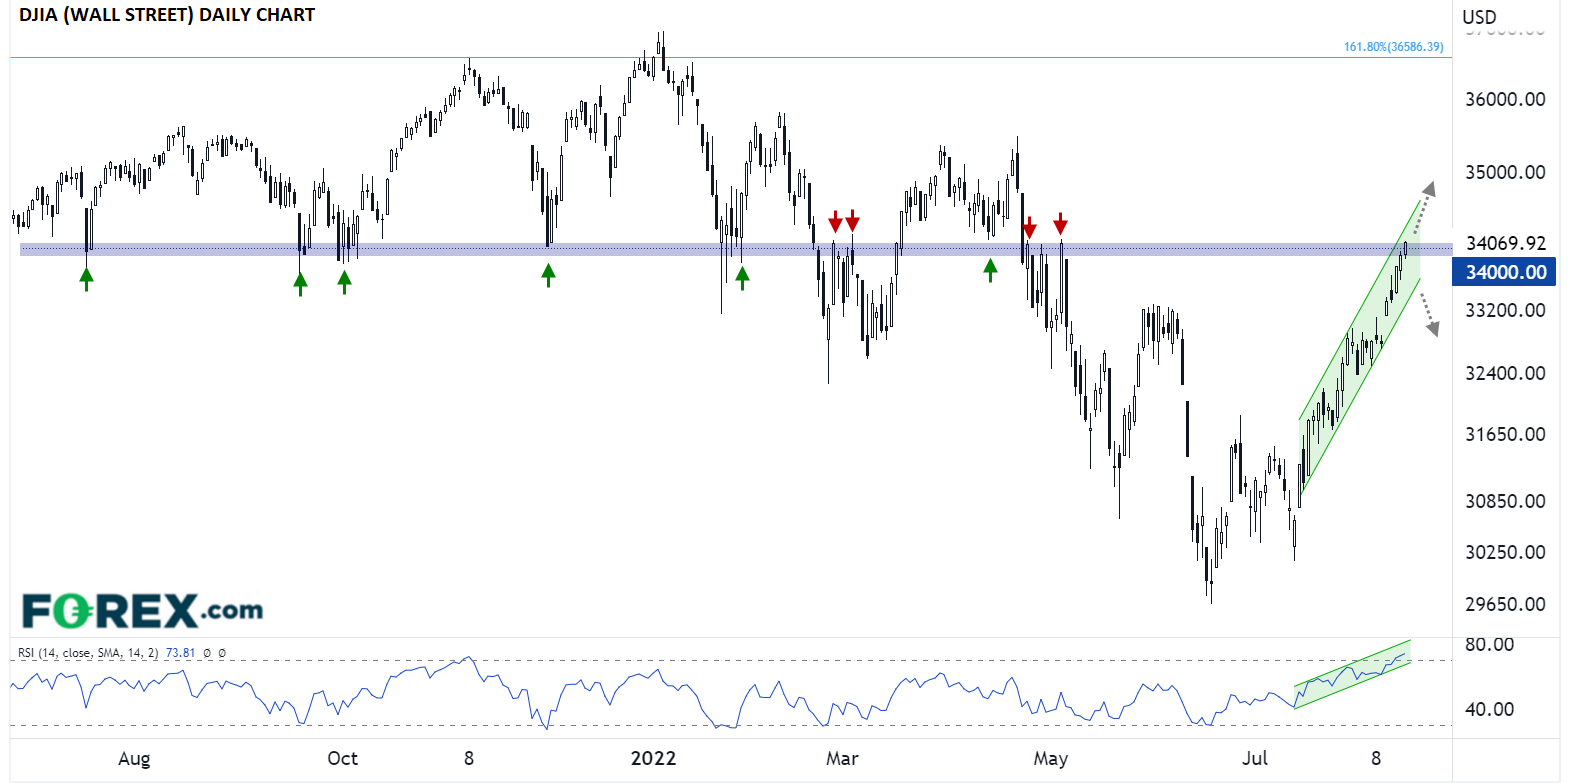
As we go to press, the Dow is testing arguably its most important price level of the past year at 34,000. Looking at the chart below, the index consistently found support near 34K in July, September, October, November and January, and, once breaking below it, found resistance at that same level in March and May. This price action underscores the technical principle of polarity, which states that a previous support level, once broken, becomes future resistance and vice versa.
All told, the price action suggests that the 34K level is a critical bull/bear delineation point, so a confirmed break above 34K would strengthen the near-term bullish bias and potentially pave the way for a move back toward record highs around 37K later this year. Meanwhile, a strong reversal off the 34K zone that breaks the near-term bullish channel would suggest that the most-followed US index has yet to shake off this year’s bearish momentum and would point a deeper retracement back below 32K.
Source: StoneX, TradingView
Despite the lack of top-tier economic data and generally lower liquidity due to “Dog Days of Summer” trade, this week’s price action could nonetheless set the trading bias for US indices heading into September and beyond.
How to trade with FOREX.com
Follow these easy steps to start trading with FOREX.com today:
- Open a Forex.com account, or log-in if you’re already a customer.
- Search for the pair you want to trade in our award-winning platform.
- Choose your position and size, and your stop and limit levels.
- Place the trade.
After a solid day to start the week, the Dow Jones Industrial Average (Wall Street CFD) is gaining more ground today.
The proximate cause for this morning’s rally comes from the US consumer. Between a solid 11.6% y/y rise in Redbook’s weekly retail sales figure and strong results from both Walmart (WMT +5%) and Home Depot (HD +4%), traders are more confident that economic growth remains on sound footing, despite ongoing inflationary pressures.
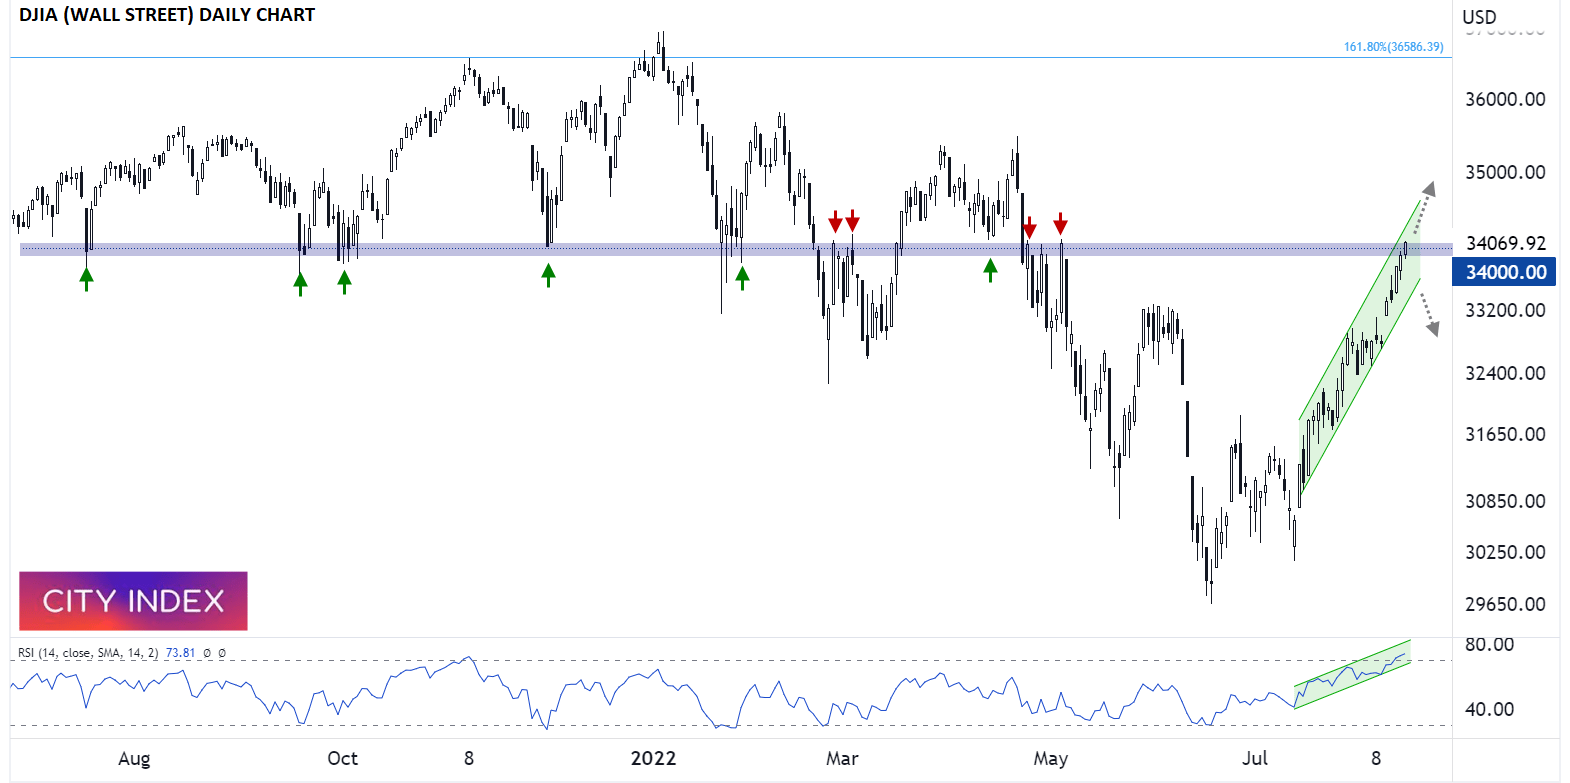
As we go to press, the Dow is testing arguably its most important price level of the past year at 34,000. Looking at the chart below, the index consistently found support near 34K in July, September, October, November and January, and, once breaking below it, found resistance at that same level in March and May. This price action underscores the technical principle of polarity, which states that a previous support level, once broken, becomes future resistance and vice versa.
All told, the price action suggests that the 34K level is a critical bull/bear delineation point, so a confirmed break above 34K would strengthen the near-term bullish bias and potentially pave the way for a move back toward record highs around 37K later this year. Meanwhile, a strong reversal off the 34K zone that breaks the near-term bullish channel would suggest that the most-followed US index has yet to shake off this year’s bearish momentum and would point a deeper retracement back below 32K.
Source: StoneX, TradingView
Despite the lack of top-tier economic data and generally lower liquidity due to “Dog Days of Summer” trade, this week’s price action could nonetheless set the trading bias for US indices heading into September and beyond.
How to trade with City Index
You can trade with City Index by following these four easy steps:
- Open an account, or log in if you’re already a customer
• Open an account in the UK
• Open an account in Australia
• Open an account in Singapore
- Search for the market you want to trade in our award-winning platform
- Choose your position and size, and your stop and limit levels
- Place the trade
Related tags:



Open an account in minutes
Experience award-winning platforms with fast and secure execution.
Economic calendar
Web Trader platform
Our sophisticated web-based platform is packed with features.
Related articles
Bitcoin's Bigger Problem Isn't AI
Bitcoin, semis and even gold are getting hammered. Our research suggests an overlooked macro force may help explain why, with Bitcoin now approaching a major support zone.

US dollar rally loses yield support as Nvidia looms
US yields are retreating, but the dollar isn't following. With risk aversion potentially keeping it supported, Nvidia's results could determine whether emerging reversal signals in AUD/USD and EUR/USD develop further.

Gold Price Short-term Outlook: XAU/USD Bears Face Critical Test at Yearly Lows 11 17 2026
Gold's decline is showing signs of exhaustion at major support, with a pivotal range break in focus ahead of the FOMC minutes.

StoneX Financial Ltd (trading as "FOREX.com") is an execution-only service provider. This material, whether or not it states any opinions, is for general information purposes only and it does not take into account your personal circumstances or objectives. This material has been prepared using the thoughts and opinions of the author and these may change. However, FOREX.com does not plan to provide further updates to any material once published and it is not under any obligation to keep this material up to date.
This material is short term in nature and may only relate to facts and circumstances existing at a specific time or day. Nothing in this material is (or should be considered to be) financial, investment, legal, tax or other advice and no reliance should be placed on it. No opinion given in this material constitutes a recommendation by FOREX.com or the author that any particular investment, security, transaction or investment strategy is suitable for any specific person.
The material has not been prepared in accordance with legal requirements designed to promote the independence of investment research. Although FOREX.com is not specifically prevented from dealing before providing this material, FOREX.com does not seek to take advantage of the material prior to its dissemination. This material is not intended for distribution to, or use by, any person in any country or jurisdiction where such distribution or use would be contrary to local law or regulation. For further details see our full non-independent research disclaimer and quarterly summary.