



Indices weekly outlook: FTSE holds steady ahead of UK data after tech volatility
Last week saw the technology sector take a plunge, before dip buyers stepped in on Friday to save the day, helping to fuel a late rally on Wall Street. In Europe, the major indices also came off their earlier lows to close either flat or in the positive. In the week ahead, the global macro calendar is lighter, with US market closed on Tuesday in observance of Veterans Day.
Share this:

Last week saw the technology sector take a plunge, before dip buyers stepped in on Friday to save the day, helping to fuel a late rally on Wall Street. In Europe, the major indices also came off their earlier lows to close either flat or in the positive. In the week ahead, the global macro calendar is lighter, with US market closed on Tuesday in observance of Veterans Day. With the US government shutdown ongoing, economic data releases will be sparse from the world’s largest economy. But we will have some important data from the UK, putting the FTSE 100 forecast in focus.
Tech selling done, or more pain to come?
Last week saw major tech companies see their shares drop across the board, before bouncing on Friday. Still, it was a bearish week and the fact the S&P 500 Information Technology was bearing the brunt of the selling shouldn’t come as surprise given that the ETF has a 22.6% weighting allocated for Nvidia alone, and 20% for Apple. Nvidia dropped sharply last week before it rebounded on Friday, amid concerns about AI related valuations. But it is a popular stock and there will be a lot of demand for it at lower levels. So, I don’t expect this sell-off to turn into a full-blown bear trend. Once some froth is removed, Nvidia and the like should be able to hold their own and provide support for the wider markets. A correction was both needed and overdue.
Still, there are several factors that could drive the market lower in the short-term. To begin with, the prolonged US government shutdown is finally denting risk appetite, something investors had largely brushed aside until now. The latest signs of a cooling US labour market are adding to the unease, prompting a shift toward defensive assets. Last week’s Challenger report showed more than 153,000 job cuts in the US, primarily in the tech and warehousing sectors. With official federal data still unavailable, investors are relying heavily on private reports — leading to heightened volatility. Although the ADP payrolls data briefly lifted sentiment, money markets are now pricing in a greater probability of a Federal Reserve rate cut in December.
Predicting a turnaround is tricky, but nothing can be ruled out. So far, every attempt at a short-term recovery has fizzled this month, suggesting that buyers remain hesitant. A sustained rebound will likely require a more decisive shift in sentiment, potentially triggered by the reopening of the US government, or by a deeper market correction making stocks more appealing from a valuation point of view.
FTSE 100 forecast: UK earnings and GDP in focus
UK average earnings will be released on Tuesday, November 11 at 07:00 GMT. The Bank of England was more dovish when holding rates last week, as 4 instead of 3 MPC members expected voted to cut rates. The Bank said rates are likely on gradual downward path and that risk to inflation is now more balance. Earnings feed into inflation so any weakness here could cement expectations for a December cut.
Meanwhile UK’s Q3 GDP will be release on Thursday, November 13 at 07:00 GMT. The UK economy has been expanding at a faster pace than expected in the last three quarters, most recently GDP increased by 0.3% in Q2. As well as monthly and quarterly GDP estimates, we will also have construction and manufacturing output, industrial production and a few other UK macro indicators released at the same time.
FTSE technical analysis
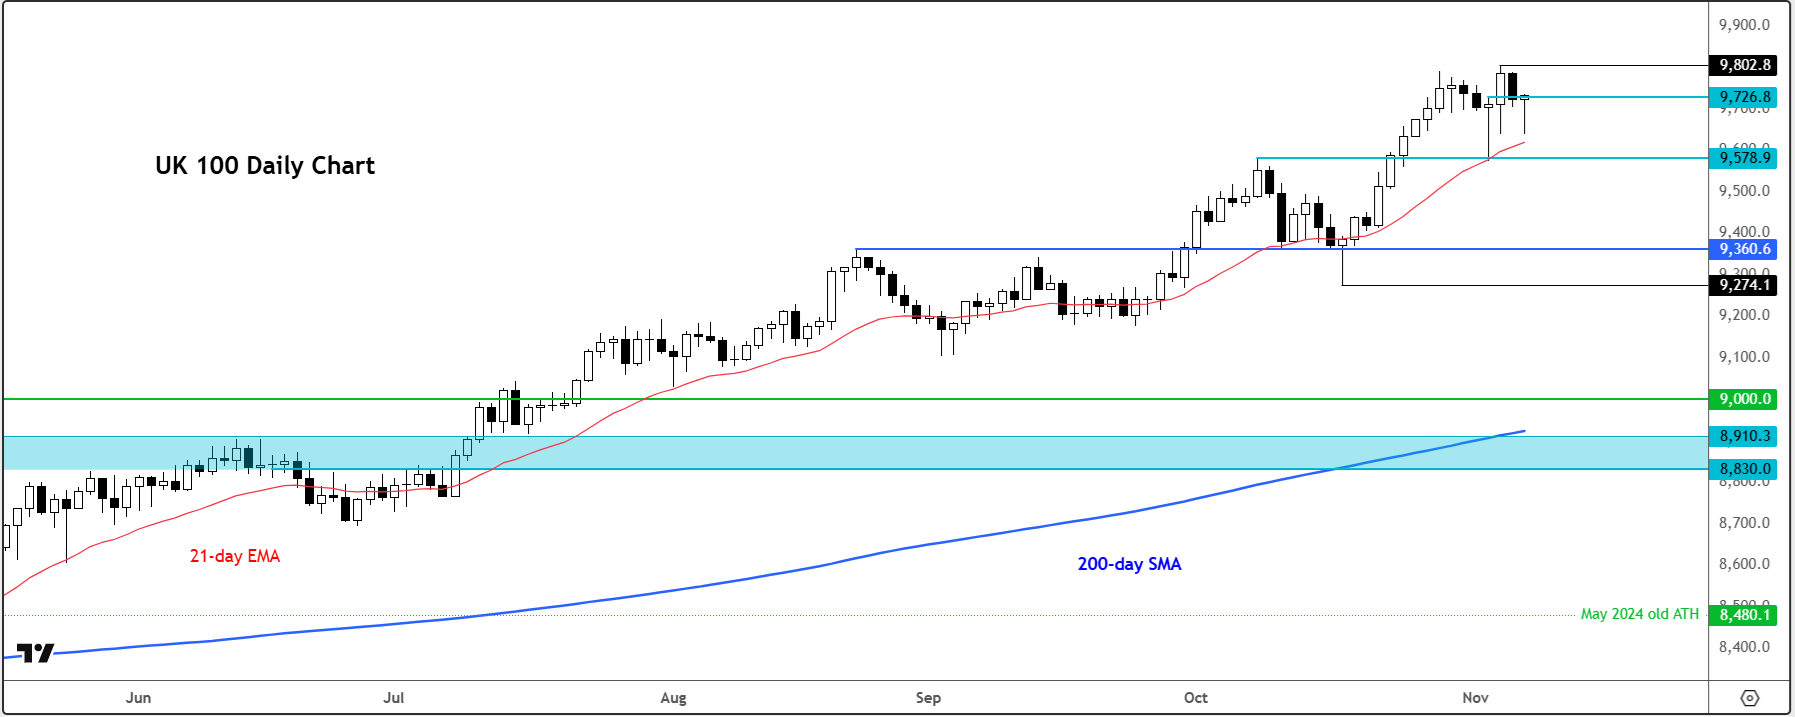
The FTSE 100 close the week right where it had ended the previous one. In other words, the weekly price action resulted in the formation of a doji candle on the weekly, which is indecisive. But looking at the daily chart, one case see that it has created a hammer-like candle on Friday. But similar price action was created earlier last week when we had a hammer candle on Tuesday following a three day consolidation or pullback. The gains that followed then were quite mild, even if the index hit a new all-time high. But then, the index came back from those highs to close the week flat. So, momentum has been lost in the FTSE 100, along with other major indices. Which makes it a little bit more risky this time to forecast a positive start to the week ahead, despite the bullish price action observed on Friday.
Nevertheless, the path of least resistance remains to be upside from here. New record heights cannot be ruled out, with 9,800, 9,900 and finally 10,000 being the next upside targets. On the way down, support comes in at 9,600. Below that we have 9500 next.


-- Written by Fawad Razaqzada, Market Analyst
Follow Fawad on Twitter @Trader_F_R
How to trade with City Index
You can trade with City Index by following these four easy steps:
- Open an account, or log in if you’re already a customer
• Open an account in the UK
• Open an account in Australia
• Open an account in Singapore
- Search for the company you want to trade in our award-winning platform
- Choose your position and size, and your stop and limit levels
- Place the trade
Related tags:



Open an account in minutes
Experience award-winning platforms with fast and secure execution.
Economic calendar
Web Trader platform
Our sophisticated web-based platform is packed with features.
Related articles
China's steel slump leaves iron ore bulls under the pump
Iron ore has broken major support, threatening a return to the lows of 2022 as mounting evidence of weakness in China's steel sector reinforces the bearish outlook.

USD/JPY, AUD/JPY: Central Bank Divergence Creates Two-Way Risk
USD/JPY eyes a breakout above 160, while AUD/JPY faces further losses as Fed, RBA and BoJ interest rate expectations diverge.


Gold and silver forecast: Precious metals extend drop but seasonality hopes keeps bullish case alive
It has been a risk off session so far today with stocks, gold and especially silver (-4%) all taking a drop. Gold has fallen to a fresh 2026 low and its now more than $100 below the psychologically important $4,000 mark. A firmer US dollar, rising US rate expectations and fading safe-haven demand have combined to undermine the metal, despite continued central bank buying. This year has so far been a bad one for gold.
StoneX Financial Ltd (trading as "FOREX.com") is an execution-only service provider. This material, whether or not it states any opinions, is for general information purposes only and it does not take into account your personal circumstances or objectives. This material has been prepared using the thoughts and opinions of the author and these may change. However, FOREX.com does not plan to provide further updates to any material once published and it is not under any obligation to keep this material up to date.
This material is short term in nature and may only relate to facts and circumstances existing at a specific time or day. Nothing in this material is (or should be considered to be) financial, investment, legal, tax or other advice and no reliance should be placed on it. No opinion given in this material constitutes a recommendation by FOREX.com or the author that any particular investment, security, transaction or investment strategy is suitable for any specific person.
The material has not been prepared in accordance with legal requirements designed to promote the independence of investment research. Although FOREX.com is not specifically prevented from dealing before providing this material, FOREX.com does not seek to take advantage of the material prior to its dissemination. This material is not intended for distribution to, or use by, any person in any country or jurisdiction where such distribution or use would be contrary to local law or regulation. For further details see our full non-independent research disclaimer and quarterly summary.