



Is Gold’s shine about to fade?
With Gold sitting at resistance, the RSI diverging with price, and managed funds extremely bullish, there may be a pullback
Share this:

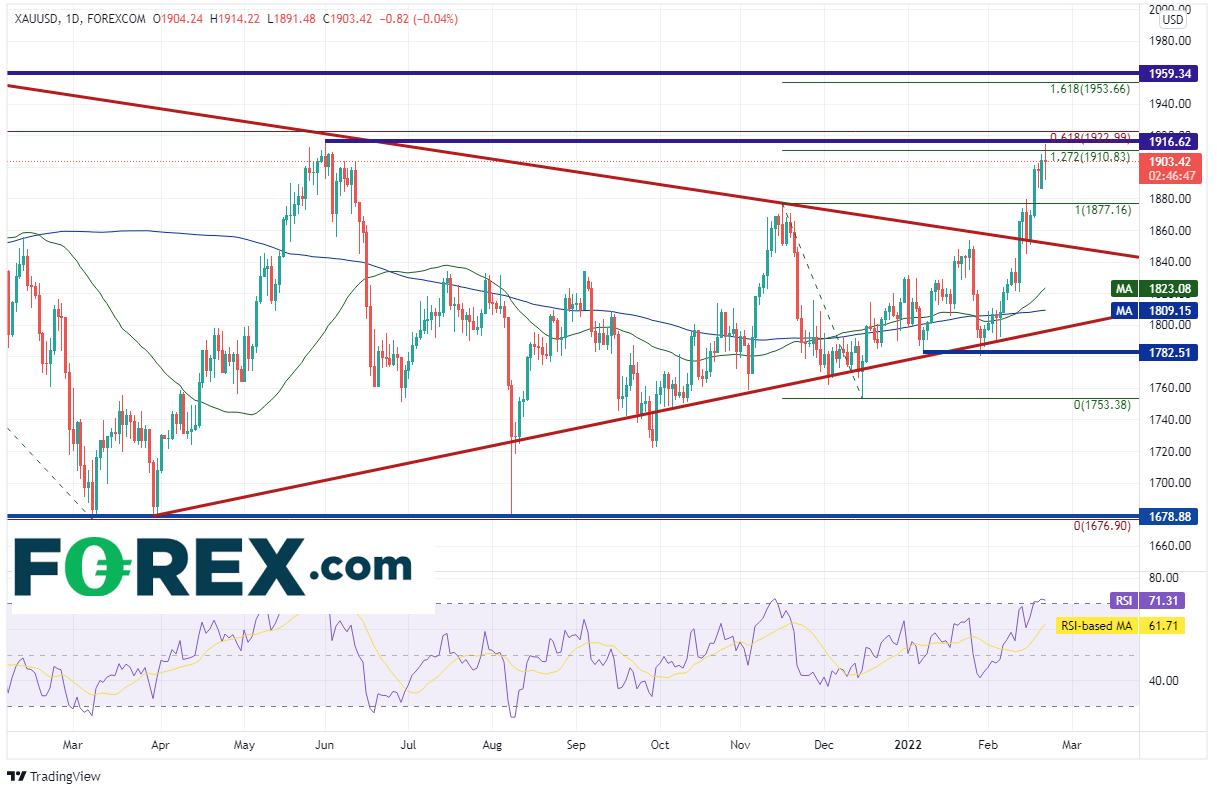
As Russia was building troops along the Ukraine border, Gold (XAU/USD) was nearing the apex of a long-term symmetrical triangle. Finally, on February 11th, as the “flight to safety” trade began in earnest, Gold broke out above the top, downward sloping trendline of the triangle. As we wrote about last week, price moved higher towards a large resistance area between 1910 and 1923. The resistance in this area is made up of the following;
- The 127.2% Fibonacci extension from the highs of November 16th, 2021 to the lows of December 15th, 2021
- Horizontal resistance from the highs of June 1st, 2021
- The 61.8% Fibonacci retracement from the all-time highs on August 7th, 2020 to the lows of March 8th, 2021.
Source: Tradingview, Stone X
Not only was the move to this area precipitated by the fear of an invasion, but it was also due to rising inflation and sentiment. In particular, the most recent COT report which showed that managed funds most bullish on gold in 3 months. Today, the price of Gold traded as high as 1914.22 and was rejected. Does this mean that the Gold prices will move lower?
Source: Tradingview, Stone X
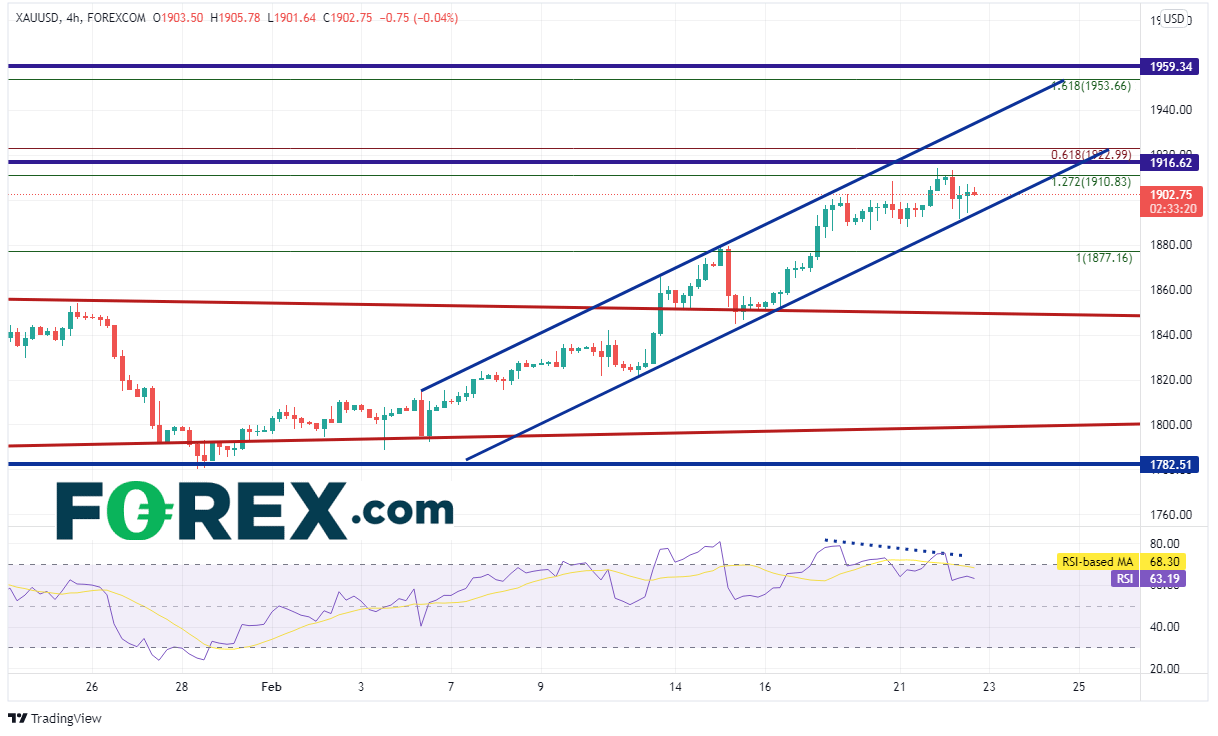
Notice on the 240-minute timeframe that the RSI is diverging with price. If price does move lower, first support is at today’s lows near 1891.48 and then horizontal support near 1877.16. The top, downward sloping trendline of the long-term trendline (red) is the next support level near 1850. However, if price is able trade above 1923, the top trendline of the channel is the first level of resistance at 1934. Above there is a confluence of resistance at the 161.8% Fibonacci extension from the November 16th, 2021 highs to the December 15th, 2021 lows and horizontal resistance from the January 6th, 2021 highs between 1953.66 and 1959.34. The psychological round number resistance is just above there at 2000.
Russia has moved into Donetsk and Luhansk and some believe Putin is set to move further into Ukraine. Will that draw more ire from the West which will lead to war? That has yet to be determined. However, right now, with Gold sitting at a confluence of resistance, the RSI diverging with price, and managed funds extremely bullish the yellow metal, there may be a pullback before it resumes higher.
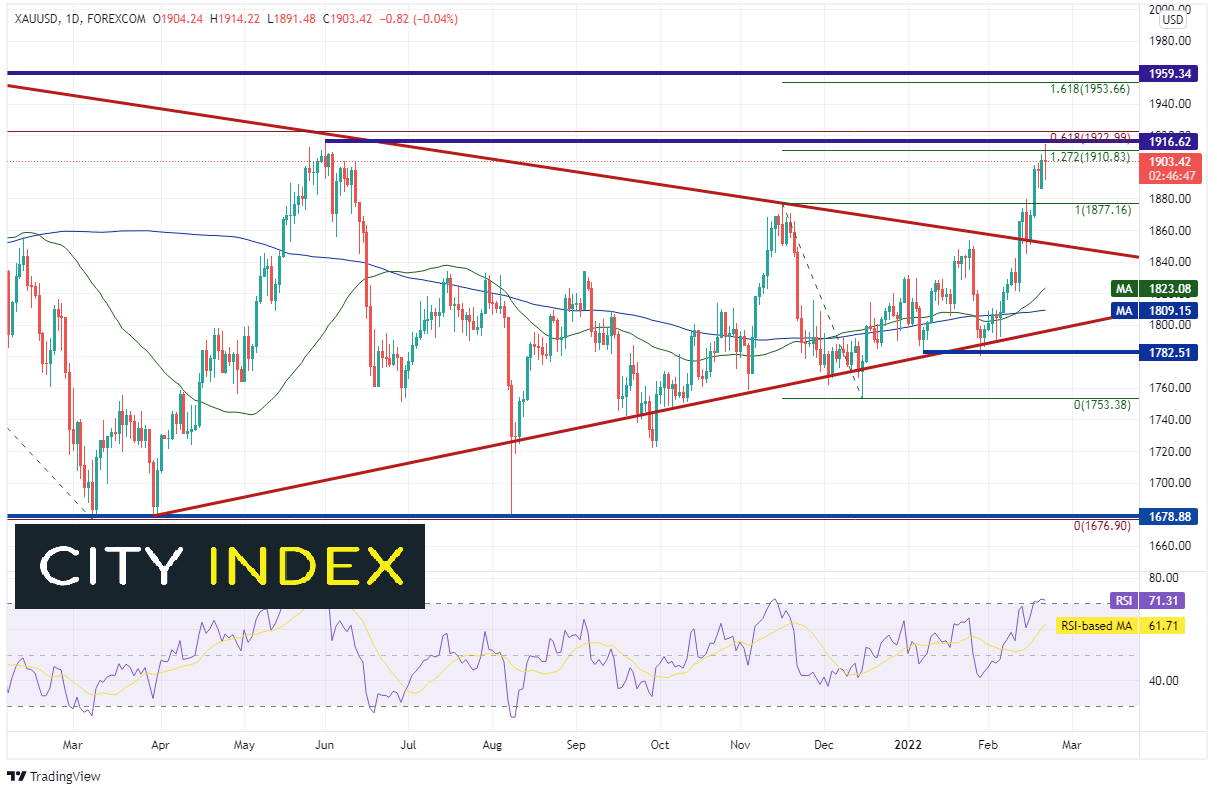
As Russia was building troops along the Ukraine border, Gold (XAU/USD) was nearing the apex of a long-term symmetrical triangle. Finally, on February 11th, as the “flight to safety” trade began in earnest, Gold broke out above the top, downward sloping trendline of the triangle. As we wrote about last week, price moved higher towards a large resistance area between 1910 and 1923. The resistance in this area is made up of the following;
- The 127.2% Fibonacci extension from the highs of November 16th, 2021 to the lows of December 15th, 2021
- Horizontal resistance from the highs of June 1st, 2021
- The 61.8% Fibonacci retracement from the all-time highs on August 7th, 2020 to the lows of March 8th, 2021.
Source: Tradingview, Stone X
Not only was the move to this area precipitated by the fear of an invasion, but it was also due to rising inflation and sentiment. In particular, the most recent COT report which showed that managed funds most bullish on gold in 3 months. Today, the price of Gold traded as high as 1914.22 and was rejected. Does this mean that the Gold prices will move lower?

Source: Tradingview, Stone X
Trade Gold (XAU/USD) now: Login or Open a new account!
• Open an account in the UK
• Open an account in Australia
• Open an account in Singapore
Notice on the 240-minute timeframe that the RSI is diverging with price. If price does move lower, first support is at today’s lows near 1891.48 and then horizontal support near 1877.16. The top, downward sloping trendline of the long-term trendline (red) is the next support level near 1850. However, if price is able trade above 1923, the top trendline of the channel is the first level of resistance at 1934. Above there is a confluence of resistance at the 161.8% Fibonacci extension from the November 16th, 2021 highs to the December 15th, 2021 lows and horizontal resistance from the January 6th, 2021 highs between 1953.66 and 1959.34. The psychological round number resistance is just above there at 2000.
Russia has moved into Donetsk and Luhansk and some believe Putin is set to move further into Ukraine. Will that draw more ire from the West which will lead to war? That has yet to be determined. However, right now, with Gold sitting at a confluence of resistance, the RSI diverging with price, and managed funds extremely bullish the yellow metal, there may be a pullback before it resumes higher.
Learn more about metals trading opportunities.
Related tags:


Open an account in minutes
Experience award-winning platforms with fast and secure execution.
Economic calendar
Web Trader platform
Our sophisticated web-based platform is packed with features.
Related articles
China's steel slump leaves iron ore bulls under the pump
Iron ore has broken major support, threatening a return to the lows of 2022 as mounting evidence of weakness in China's steel sector reinforces the bearish outlook.

NZD/USD Forecast: Kiwi faces historic breakdown as RBNZ survey looms
NZD/USD is teetering above support that held through the pandemic and Liberation Day turmoil. With RBNZ hawks repeatedly disappointed, today's inflation expectations survey could open the door to a slide towards the GFC lows.

USD/JPY, AUD/JPY: Central Bank Divergence Creates Two-Way Risk
USD/JPY eyes a breakout above 160, while AUD/JPY faces further losses as Fed, RBA and BoJ interest rate expectations diverge.

StoneX Financial Ltd (trading as "FOREX.com") is an execution-only service provider. This material, whether or not it states any opinions, is for general information purposes only and it does not take into account your personal circumstances or objectives. This material has been prepared using the thoughts and opinions of the author and these may change. However, FOREX.com does not plan to provide further updates to any material once published and it is not under any obligation to keep this material up to date.
This material is short term in nature and may only relate to facts and circumstances existing at a specific time or day. Nothing in this material is (or should be considered to be) financial, investment, legal, tax or other advice and no reliance should be placed on it. No opinion given in this material constitutes a recommendation by FOREX.com or the author that any particular investment, security, transaction or investment strategy is suitable for any specific person.
The material has not been prepared in accordance with legal requirements designed to promote the independence of investment research. Although FOREX.com is not specifically prevented from dealing before providing this material, FOREX.com does not seek to take advantage of the material prior to its dissemination. This material is not intended for distribution to, or use by, any person in any country or jurisdiction where such distribution or use would be contrary to local law or regulation. For further details see our full non-independent research disclaimer and quarterly summary.