



Is USD/CAD ready to pull back?
With significant resistance above, the chance of stronger than expected inflation data, and the possibility of a “less hawkish than expected” Fed, it Is possible that the pair will move lower.
Share this:

USD/CAD reached its highest level since November 3rd, 2020 today as price continues to shoot higher, reaching an intra-day high today of 1.3344. However, is the pair ready to pull back? After a 220 pip move higher last week, USD/CAD is running into some resistance. Not only is the pair trading at the November 3rd, 2020 highs, but it is also trading right at the 50% retracement level from the pandemic highs of 1.4667 in March 2020 to the lows in May 2021, near 1.3339. In addition, USD/CAD is trading at the top trendline of an upward sloping channel that the pair has been in since March, near 1.3418.

Source: Tradingview, Stone X
With USD/CAD trading near all that resistance, what can help it to move lower? Canada releases its August CPI data Tuesday morning. Expectations are for an increase of 7.3% YoY vs a prior reading of 7.7% YoY. In addition, the Core CPI is expected to be 6.2% vs 6.1% in July. If either of these readings come in stronger than expected, USD/CAD may move lower. The US Federal Reserve also meets this week to discuss interest rate policy on Wednesday. If the Committee raises rates by less than 75bps or if it hikes with dovish comments, the US Dollar may move lower, dragging down USD/CAD with it.
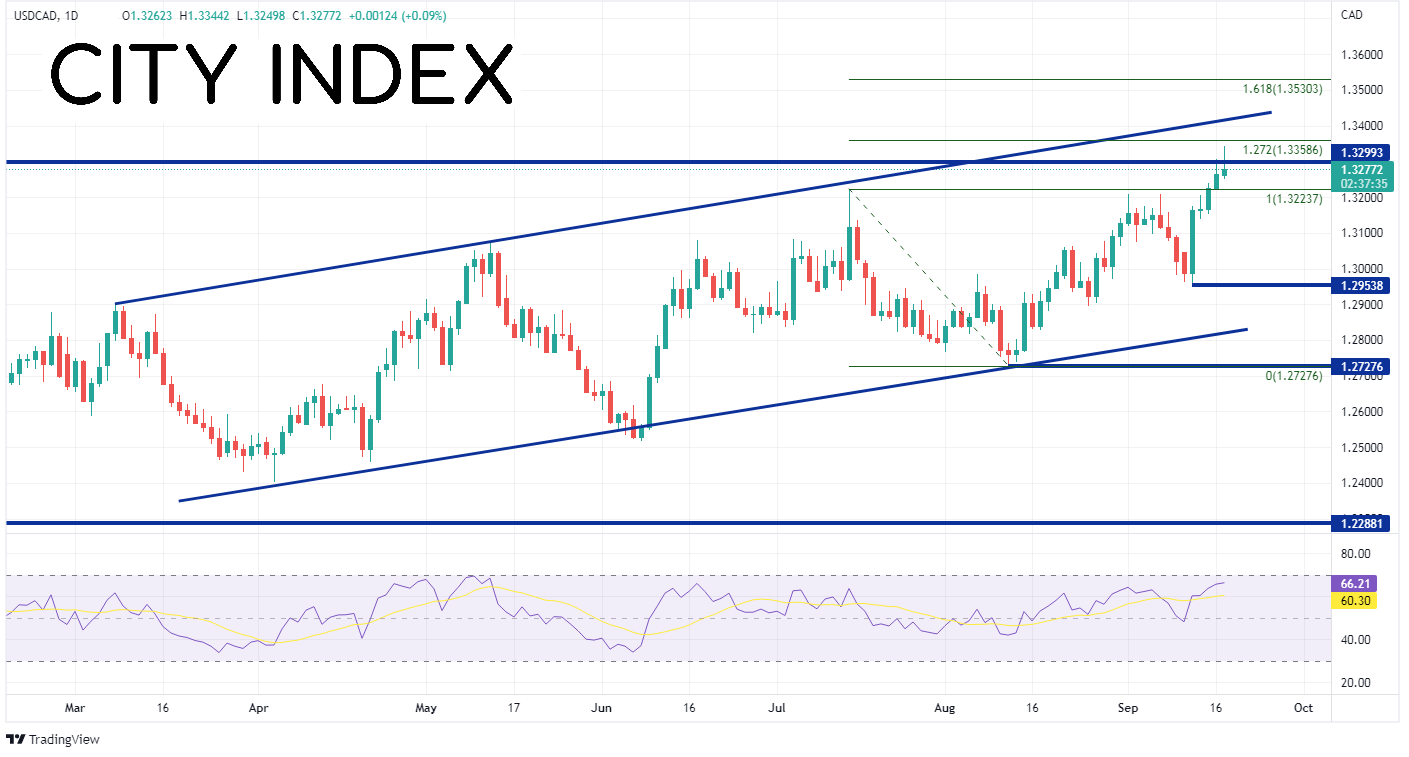
Technically, not only is USD/CAD trading with the above-mentioned resistance on the weekly timeframe, but there is also signs of pulling back on the daily timeframe. Today, price traded to just below the 127.2% Fibonacci extension from the highs of July 14th to the lows of August 11th, near 1.3359. This acts as the first resistance level (and confluences nicely with the 50% retracement level from the weekly timeframe near 1.3339). The next resistance level is the top trendline of the channel near 1.3418, then the 161.8% Fibonacci extension from the previously mentioned timeframe near 1.3530. In addition to the resistance, price has formed an inverted hammer, which indicates a possible reversal signal. If price does move lower, first support is at Friday’s low and the July 14th highs near 1.3224. Below there, price can fall to the lows of September 13th at 1.2954 and then the bottom trendline of the upward sloping channel near 1.2810.

Source: Tradingview, Stone X
Will USD/CAD reverse and move lower? With significant resistance above, the chance of stronger than expected inflation data, and the possibility of a “less hawkish than expected” Fed, it Is possible. However, if the inflation data is weaker or the Fed is uber-hawkish, USD/CAD may continue its path higher. Shorts will most likely have tight stops above today's highs.
USD/CAD reached its highest level since November 3rd, 2020 today as price continues to shoot higher, reaching an intra-day high today of 1.3344. However, is the pair ready to pull back? After a 220 pip move higher last week, USD/CAD is running into some resistance. Not only is the pair trading at the November 3rd, 2020 highs, but it is also trading right at the 50% retracement level from the pandemic highs of 1.4667 in March 2020 to the lows in May 2021, near 1.3339. In addition, USD/CAD is trading at the top trendline of an upward sloping channel that the pair has been in since March, near 1.3418.

Source: Tradingview, Stone X
Your guide to the Canadian Dollar
With USD/CAD trading near all that resistance, what can help it to move lower? Canada releases its August CPI data Tuesday morning. Expectations are for an increase of 7.3% YoY vs a prior reading of 7.7% YoY. In addition, the Core CPI is expected to be 6.2% vs 6.1% in July. If either of these readings come in stronger than expected, USD/CAD may move lower. The US Federal Reserve also meets this week to discuss interest rate policy on Wednesday. If the Committee raises rates by less than 75bps or if it hikes with dovish comments, the US Dollar may move lower, dragging down USD/CAD with it.
Everything you need to know about the Federal Reserve
Technically, not only is USD/CAD trading with the above-mentioned resistance on the weekly timeframe, but there is also signs of pulling back on the daily timeframe. Today, price traded to just below the 127.2% Fibonacci extension from the highs of July 14th to the lows of August 11th, near 1.3359. This acts as the first resistance level (and confluences nicely with the 50% retracement level from the weekly timeframe near 1.3339). The next resistance level is the top trendline of the channel near 1.3418, then the 161.8% Fibonacci extension from the previously mentioned timeframe near 1.3530. In addition to the resistance, price has formed an inverted hammer, which indicates a possible reversal signal. If price does move lower, first support is at Friday’s low and the July 14th highs near 1.3224. Below there, price can fall to the lows of September 13th at 1.2954 and then the bottom trendline of the upward sloping channel near 1.2810.
Source: Tradingview, Stone X
Trade USD/CAD now: Login or Open a new account!
• Open an account in the UK
• Open an account in Australia
• Open an account in Singapore
Will USD/CAD reverse and move lower? With significant resistance above, the chance of stronger than expected inflation data, and the possibility of a “less hawkish than expected” Fed, it Is possible. However, if the inflation data is weaker or the Fed is uber-hawkish, USD/CAD may continue its path higher. Shorts will most likely have tight stops above today's highs.
Learn more about forex trading opportunities.
Related tags:
Latest market news




Open an account in minutes
Experience award-winning platforms with fast and secure execution.
Economic calendar
Web Trader platform
Our sophisticated web-based platform is packed with features.
Related articles
EUR/USD outlook: euro back above 1.1000 as dollar rally loses steam
EUR/USD has recovered back above 1.1000 after a brief break lower, a sign the dollar's inflation-driven rally may be losing momentum. With a December Fed hike largely priced in and oil a potential tailwind for the euro, the risks are starting to tilt to the upside.
Gold Price Short-term Outlook: XAU/USD Bears Face Critical Test at Yearly Lows 11 17 2026
Gold's decline is showing signs of exhaustion at major support, with a pivotal range break in focus ahead of the FOMC minutes.

USD/CAD Forecast: Canadian Dollar Remains Under Pressure After Inflation Data
As the end of 2026 draws closer, one of the most notable themes in the currency market remains the weakness of the Canadian dollar against its U.S. counterpart. Over the past five trading sessions alone, USD/CAD has gained nearly 0.8%, highlighting the consistent strength that the U.S. dollar has continued to display.

StoneX Financial Ltd (trading as "FOREX.com") is an execution-only service provider. This material, whether or not it states any opinions, is for general information purposes only and it does not take into account your personal circumstances or objectives. This material has been prepared using the thoughts and opinions of the author and these may change. However, FOREX.com does not plan to provide further updates to any material once published and it is not under any obligation to keep this material up to date.
This material is short term in nature and may only relate to facts and circumstances existing at a specific time or day. Nothing in this material is (or should be considered to be) financial, investment, legal, tax or other advice and no reliance should be placed on it. No opinion given in this material constitutes a recommendation by FOREX.com or the author that any particular investment, security, transaction or investment strategy is suitable for any specific person.
The material has not been prepared in accordance with legal requirements designed to promote the independence of investment research. Although FOREX.com is not specifically prevented from dealing before providing this material, FOREX.com does not seek to take advantage of the material prior to its dissemination. This material is not intended for distribution to, or use by, any person in any country or jurisdiction where such distribution or use would be contrary to local law or regulation. For further details see our full non-independent research disclaimer and quarterly summary.