



Japanese Yen Forecast: USD/JPY Bulls Falter at Major Resistance—Critical Range Break in Focus
USD/JPY’s latest retreat puts the September recovery under scrutiny, with nearby support offering bulls their next opportunity to respond.
Share this:

Japanese Yen Technical Forecast: USD/JPY Weekly Trade Levels
- USD/JPY’s three-week rally stalled after repeated attempts to secure a weekly close above key technical resistance.
- Weekly RSI remains virtually neutral, highlighting a lack of directional conviction.
- The 52-week moving average and former closing highs mark a pivotal support confluence. A break below would threaten the late-October advance.
- Next week's U.S. GDP, Core PCE inflation and Tokyo CPI reports could fuel volatility amid thinner holiday liquidity.
- Resistance 159.75/87 (key), 160.74, 161.95- Support 158.21/33, (key), 156.67, 155.68
The U.S. Dollar has come under renewed pressure against the Japanese Yen following a three-week recovery from the October lows, with the latest USD/JPY pullback coinciding with a retreat in U.S. Treasury yields. Despite repeated attempts to extend the advance, buyers have struggled to establish a sustained move higher, leaving the pair vulnerable as November trade draws to a close. The medium-term technical structure remains constructive above key support, although neutral weekly momentum and the failure to secure a convincing breakout raise questions about the durability of the recovery. With price now approaching a significant support confluence, the next reaction could offer important clues as to whether the September uptrend remains intact or a deeper correction is developing. Battle lines are drawn on the USD/JPY weekly technical chart.
Review my latest Weekly Strategy Webinar for an in-depth breakdown of this Yen setup and more. Join me live Mondays at 8:30am EST and tune in to the Opening Bell Tuesday through Friday at 9:30am EST for continued market coverage throughout the week.
Japanese Yen Price Chart – USD/JPY Weekly
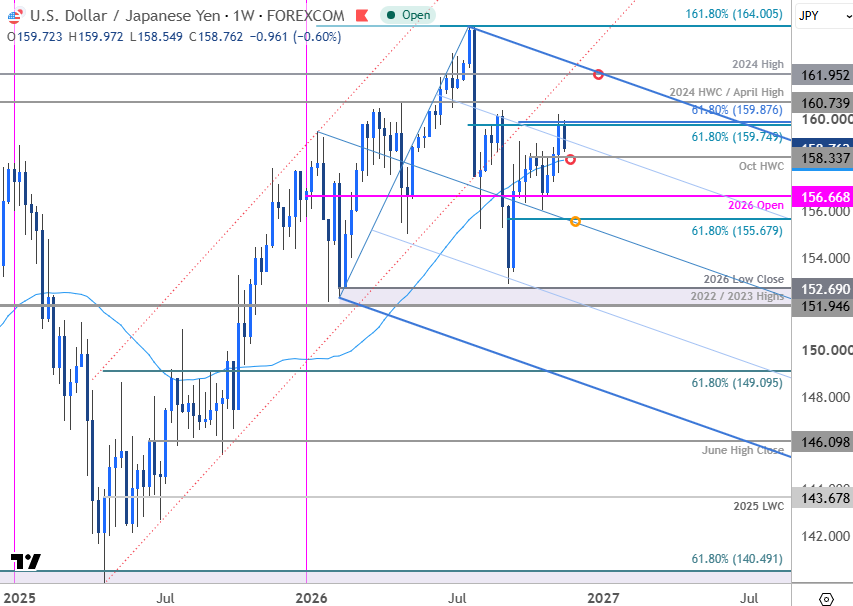
Chart Prepared by Michael Boutros, Sr. Technical Strategist; USD/JPY on TradingView
Technical Outlook: In last month’s Japanese Yen Technical Forecast we noted that, “a two-week selloff has rebounded off yearly open support, with the near-term recovery now approaching pivotal resistance into the close of the month. From a trading standpoint, the focus is on breakout of the 156.67-158.44 range for guidance.” The range broke two-weeks later with a three-week rally extending more than 2.6% off the October lows before exhausting into pivotal resistance at 159.75/87. This region is defined by the 61.8% retracement of the decline off the yearly high and the 61.8% extension of September rally. Despite numerous intraweek breakouts, the bulls were unable to mark a weekly close above. Weekly RSI is virtually neutral (51), and the momentum profile lacks conviction here into the close of the month.
The decline is now approaching confluent support at the October high-week close (HWC) and the 52-week moving average at 158.21/34. The focus heading into next week as on possible inflection off this threshold IF reached with a break / weekly close below needed to suggest a more significant high is in place and potential resumption of the broader July downtrend. Subsequent support rests with the yearly open support at 156.67 backed by the 61.8% retracement of the September advance at 155.68. Note that the median line of the July pitchfork rests just below this threshold and a break / weekly close below this slope would be needed to fuel the next major leg of the decline.
A breach above this key Fibonacci threshold would keep the September advance in play with subsequent resistance objectives eyed at the 2024 high-week close (HWC) / April high at 160.74 and the 2024 swing high at 161.95. The upper parallel converges on this threshold next month and strength surpassing this level would expose a retest of the yearly high near 164.

Bottom line: The late-October uptrend has exhausted into a major resistance hurdle and leaves the bulls vulnerable while below. The daily price chart shows the recent decline has now completed two-equal legs off the high and IF this pullback is corrective in nature, losses should be limited to this week’s low. From a trading standpoint, the focus is on breakout of the 158.21-159.87 range to fuel the next directional move in USD/JPY.
USD/JPY event risk next week will center on Wednesday’s U.S. GDP and October personal income and outlays reports, including the core PCE inflation gauge, with firm growth or price data likely to support Treasury yields and keep the pair bid. The focus then shifts to Japan, where BoJ board member Tamura is scheduled to speak Thursday ahead of Friday’s Tokyo CPI report. Stronger Japanese inflation or hawkish guidance would reinforce expectations for another BoJ hike and support the yen, while softer data could ease near-term tightening bets and stabilize the USD/JPY pullback. Thanksgiving will also shorten U.S. trading hours and leave liquidity thinner into the back extended break. Watch the weekly closes for guidance here. Review my latest Japanese Yen Short-term Outlook for a closer look at the near-term USD/JPY technical trade levels.
USD/JPY Key Economic Data Releases
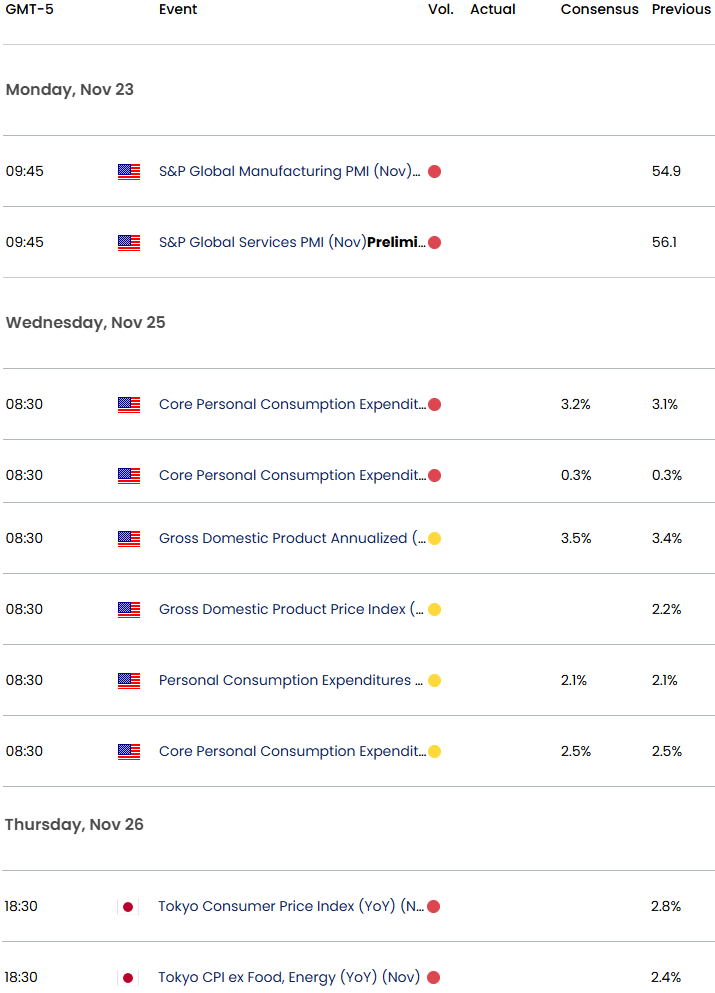
Economic Calendar - latest economic developments and upcoming event risk.
Active Weekly Technical Charts
- Australian Dollar (AUD/USD)
- Swiss Franc (USD/CHF)
- British Pound (GBP/USD)
- US Dollar Index (DXY)
- Euro (EUR/USD)
- Gold (XAU/USD)
- Bitcoin (BTC/USD)
- Canadian Dollar (USD/CAD)
- S&P 500, Nasdaq, Dow
--- Written by Michael Boutros, Senior Technical Strategist
Follow Michael on X @MBForex
Latest market news




Open an account in minutes
Experience award-winning platforms with fast and secure execution.
Economic calendar
Web Trader platform
Our sophisticated web-based platform is packed with features.
Related articles
US Dollar Freight Train Drives EUR/USD, GBP/USD to Fresh Lows
A hawkish Fed and growing jitters around AI have pushed a continued rally in the Greenback, and there’s not yet an end in sight.

Japanese Yen Forecast: USD/JPY Bulls Falter at Major Resistance—Critical Range Break in Focus 11 20 2026
USD/JPY’s latest retreat puts the September recovery under scrutiny, with nearby support offering bulls their next opportunity to respond.

Nasdaq 100, SOX: Tech rout may be a symptom of something far larger
The financial tide is going out, and some of the market's biggest winners are being hammered. Our research suggests there's more to the tech rout than the AI headlines.

StoneX Financial Ltd (trading as "FOREX.com") is an execution-only service provider. This material, whether or not it states any opinions, is for general information purposes only and it does not take into account your personal circumstances or objectives. This material has been prepared using the thoughts and opinions of the author and these may change. However, FOREX.com does not plan to provide further updates to any material once published and it is not under any obligation to keep this material up to date.
This material is short term in nature and may only relate to facts and circumstances existing at a specific time or day. Nothing in this material is (or should be considered to be) financial, investment, legal, tax or other advice and no reliance should be placed on it. No opinion given in this material constitutes a recommendation by FOREX.com or the author that any particular investment, security, transaction or investment strategy is suitable for any specific person.
The material has not been prepared in accordance with legal requirements designed to promote the independence of investment research. Although FOREX.com is not specifically prevented from dealing before providing this material, FOREX.com does not seek to take advantage of the material prior to its dissemination. This material is not intended for distribution to, or use by, any person in any country or jurisdiction where such distribution or use would be contrary to local law or regulation. For further details see our full non-independent research disclaimer and quarterly summary.