
- Nasdaq 100 threatens slingshot rally after violent sell-off
- Largest initial break below 200-day average since 2000
- Five of eight previous breakdowns quickly reversed
- Only two sustained gains, but both were spectacular
There's a slingshot feel developing in US tech stocks, with Nasdaq 100 futures rebounding rapidly from last week's violent sell-off to within touching distance of the key 200-day moving average. Given the severity of the initial breakdown, the speed of the recovery is historically rare, raising the question of whether the rally has further to run.
Certainly, Nikkei and KOSPI futures have staged strong recoveries during Asian trading, following CoreWeave's stronger-than-expected quarterly results released after the Wall Street close and reports of a potential increase in Anthropic's IPO valuation to $1.5 trillion or more.
However, for all the renewed enthusiasm, the key will be whether the buying can continue into US trading, where volumes will pick up significantly. And as history shows, reclaiming the 200-day moving average is one thing, but sustaining the recovery above it is another. Previous sharp breakdowns produced vastly different outcomes, ranging from spectacular recoveries to failed rebounds followed by substantial further declines. Price action over the coming sessions could therefore prove crucial in assessing short to medium-term directional risks.
Largest 200DMA initial breakdown in decades
Source: LSEG
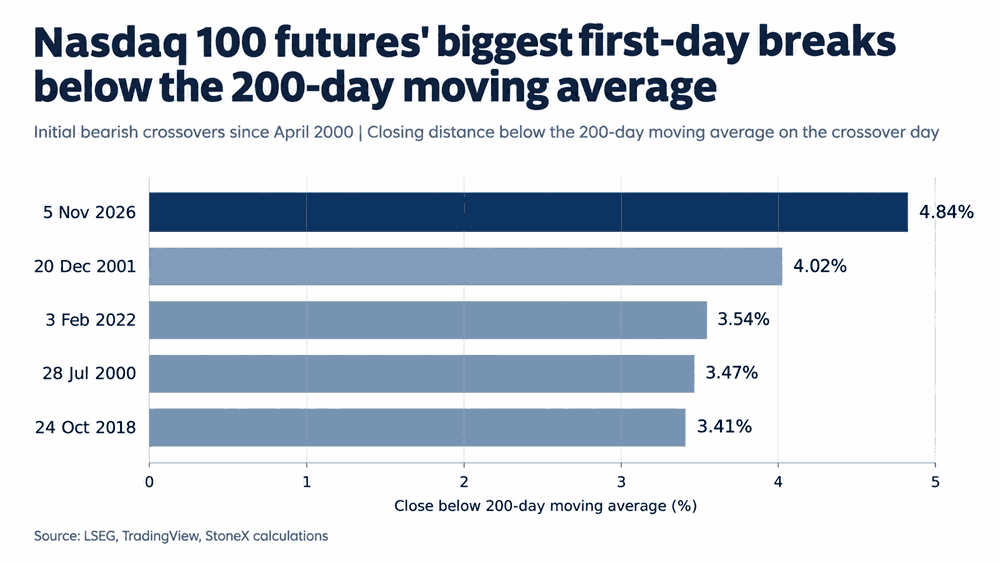
Analysis of Nasdaq 100 futures data dating back to early 2000 reveals just how extraordinary last week's breakdown beneath the 200-day moving average was. On 5 November, the price closed 4.84% below the average, the largest initial bearish crossover in the entire dataset, exceeding even those seen after the initial bursting of the technology bubble during the early-2000s tech wreck.
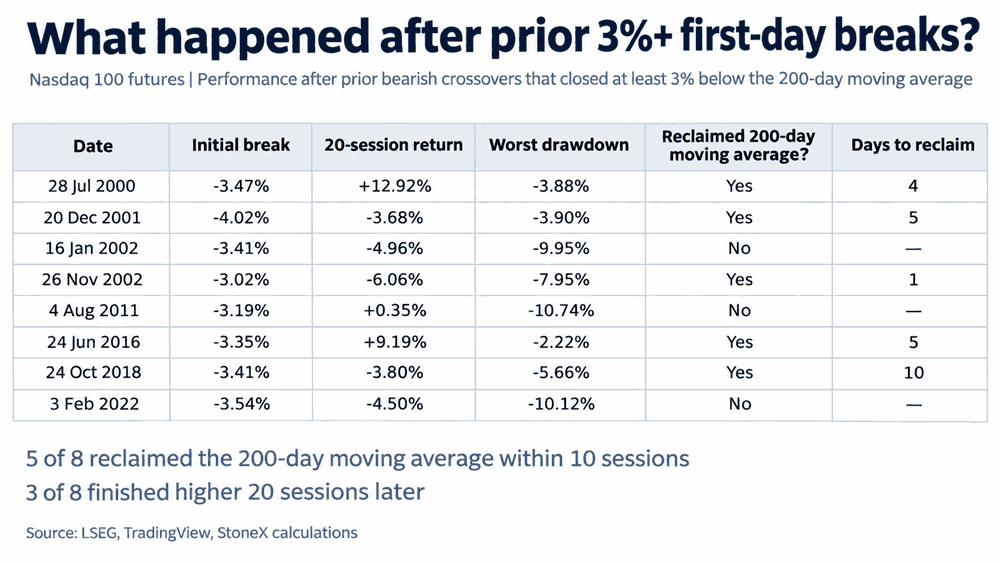
Over the entire dataset, there have been only eight previous occasions when Nasdaq 100 futures closed at least 3% beneath the 200-day moving average on the day of the initial break. Of those, five managed to reclaim the moving average within ten sessions, demonstrating that while breakdowns of this magnitude are rare, swift recoveries back above the level are not.
Source: LSEG
Of the five episodes where Nasdaq 100 futures reclaimed the 200-day moving average within ten sessions, just two delivered positive returns over the following 20 sessions, measured from the initial breakdown. The others experienced renewed selling.
However, when recoveries did gather momentum, the gains were spectacular. Following breakdowns in July 2000 and June 2016, Nasdaq 100 futures surged 12.92% and 9.19%, respectively, over the subsequent 20 sessions. At the other extreme, the November 2002 breakdown was followed by a 6.06% decline, despite the price reclaiming the moving average just one session after the initial break.
Nasdaq 100 slingshot setup takes shape
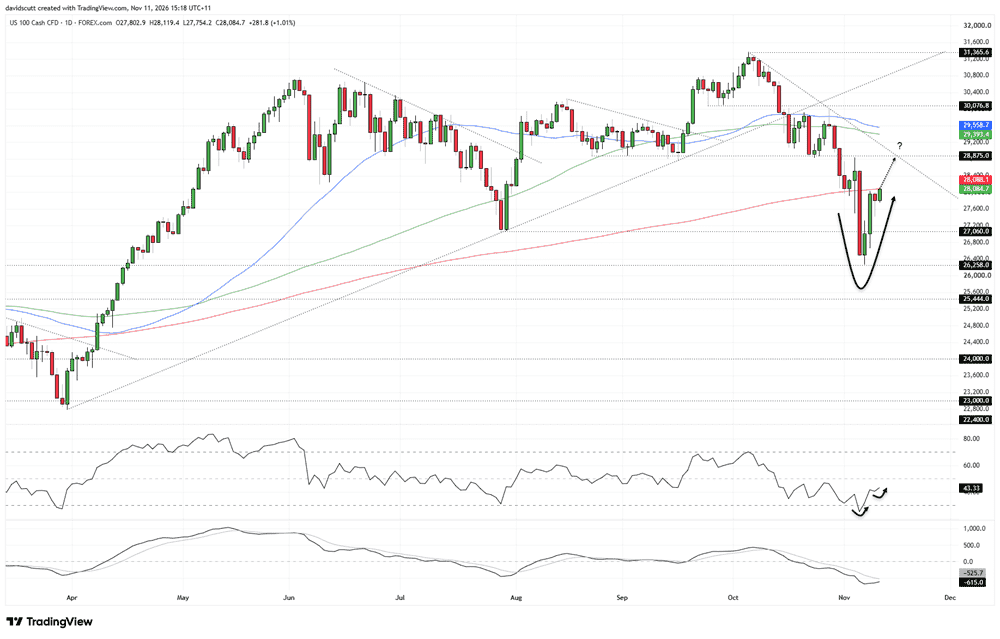
Looking at our Nasdaq 100 contract, the rebound began from 26,258, an important technical level that capped the price for lengthy periods in late 2025 and earlier this year. Having held as support during last week's violent sell-off, the subsequent recovery has brought the price back to the 200-day moving average, currently found at 28,088. Looking at the price action before last week's breakdown, it's clear traders are wary of the level, with the price testing it on three separate occasions before eventually breaking lower. That caution puts added emphasis on the near-term price action around the moving average.
For now, this remains a countertrend rally, although momentum indicators are starting to look more encouraging for the bulls. RSI (14) has been generating higher highs, while MACD is converging towards its signal line, albeit in negative territory. Together, they suggest selling pressure is easing and directional risks are becoming more balanced, potentially setting the stage for a squeeze higher should the price reclaim the 200-day moving average.
Source: TradingView
A break above the 200-day moving average that sticks, preferably followed by a backtest and bounce on a shorter time frame, would present a potential entry point for longs, allowing for a tight stop to be placed beneath the moving average for protection. Some traders may prefer to wait for a daily close above the moving average to increase confidence in the breakout.
The initial upside target would be 28,875, a former support level that held on multiple occasions before the breakdown in late October. Beyond there, the downtrend running from the record highs and the confluence of the 50 and 100-day moving averages would come into focus, should the price manage to push higher.
Conversely, if the price fails to break and hold above the 200-day moving average, the immediate bullish bias would be invalidated