



Nasdaq Could Look to KOSPI for Directional Clues Beyond Earnings
The KOSPI is testing a major support level that could offer directional clues for the Nasdaq and Nikkei as earnings season gets underway.
Share this:

The KOSPI's sharp selloff has become a key barometer for global technology sentiment, given South Korea's central role in the AI semiconductor supply chain through Samsung Electronics and SK Hynix. Now more than 30% below its record high, the index has been hit by a broad unwind in AI-related stocks, concerns over the outlook for chip demand, and a surprise rate hike from the Bank of Korea
The weakness has spilled over into regional equity markets, with the Nikkei 225 proving more sensitive to the semiconductor-led selloff than the Nasdaq in recent weeks. Wall Street indices have also come under pressure as earnings season gets underway. Against that backdrop, the KOSPI is attempting to hold a key technical support level. Whether buyers can defend it or bears force a decisive break lower, could prove pivotal for technology sentiment and broader equity markets.
View related analysis:
View related analysis:
KOSPI Tests Major Support After Sharp Selloff
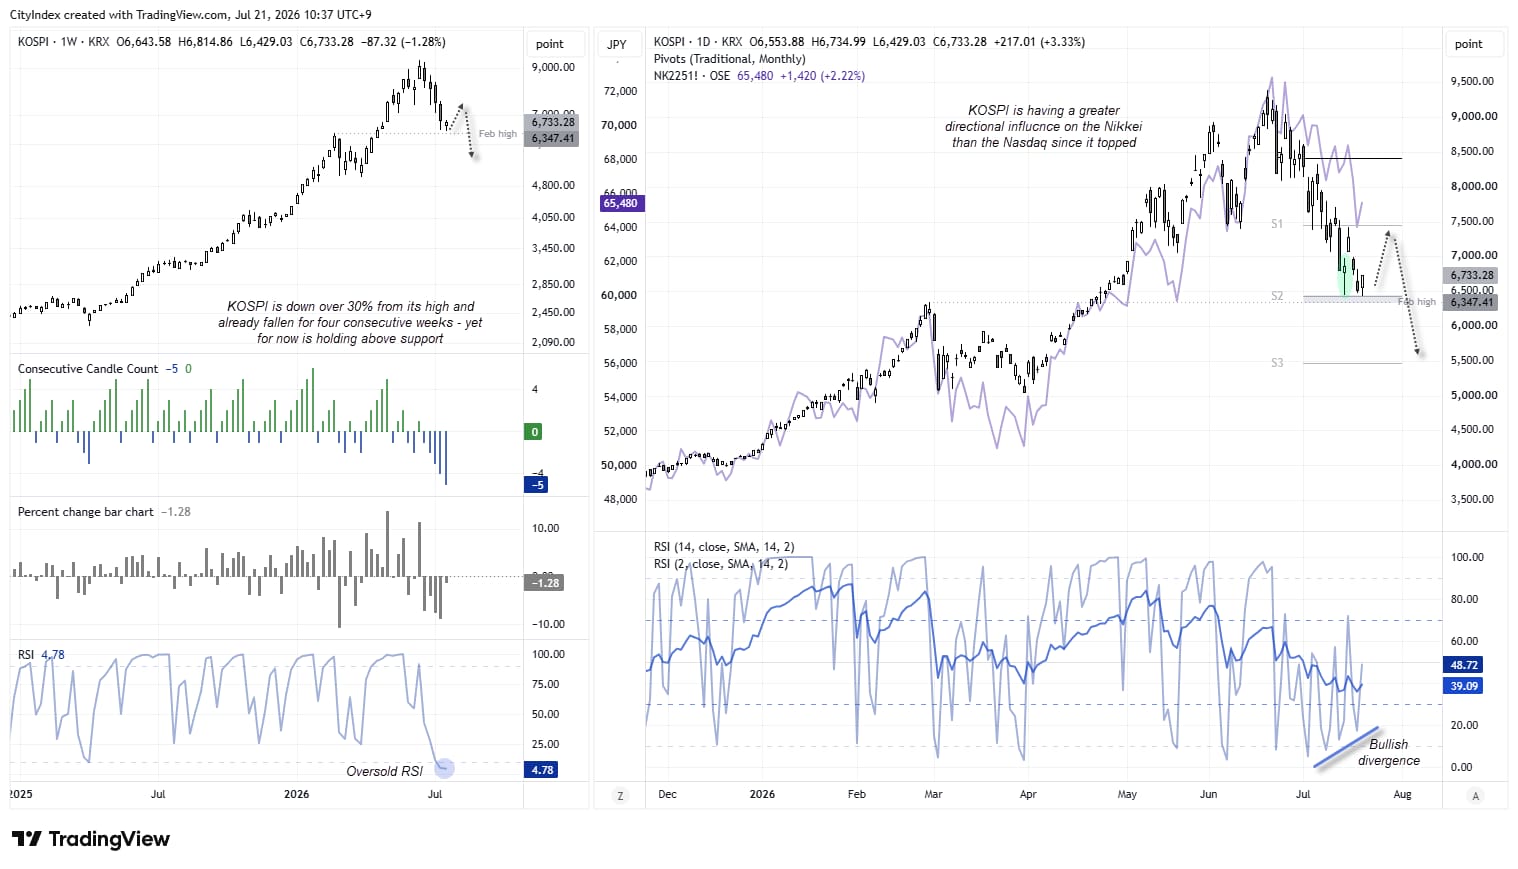
The weekly chart shows the KOSPI has fallen for four consecutive weeks and is on track for a fifth. It has not recorded a five-week losing streak since August 2024, with bearish runs typically ending after two to three weeks over the past couple of years. With the RSI (2) deeply oversold and prices holding above the February high, dip buyers may be waiting in the wings.
The daily chart shows a bullish divergence on the RSI (2), while prices continue to hold above last week's bullish pinbar low. Buyers have also stepped in today to lift the KOSPI back above 6,500.
Source: KRK, TradingView


Nasdaq 100 Futures (NQ) Technical Analysis
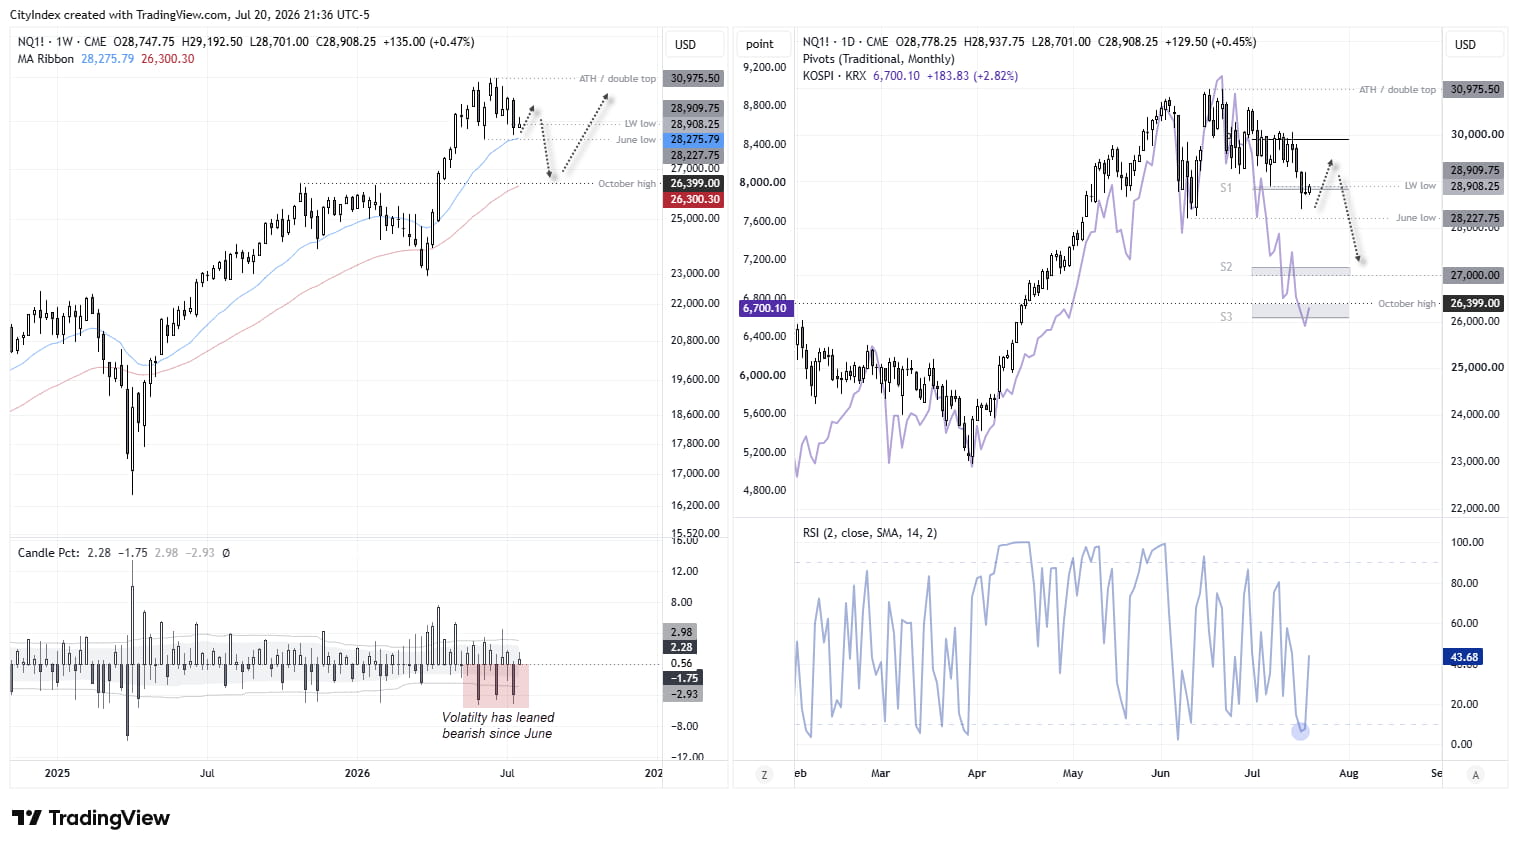
The weekly chart shows prices remain in the lower half of last week's bearish candle. Notice that volatility has favoured bears since June, with the three largest candle bodies all to the downside at around 4%. The June low (28,227) is a key support level for bears to monitor, as a break beneath it would also see prices slip below the 20-week EMA and suggest a deeper correction is underway. The next major support level is the October high (26,399), although the monthly S2 pivot point near the 27,000 handle could provide interim support if a deeper pullback unfolds.
Volatility has favoured bears since June, with the three largest weekly candle bodies all to the downside at around 4%. While the Nasdaq's pullback has been far less severe, whether prices retest the June low or rebound from current levels may ultimately depend on whether KOSPI bulls can defend their own key support level.
Source: CME, TradingView
Nasdaq 100 intraday Levels
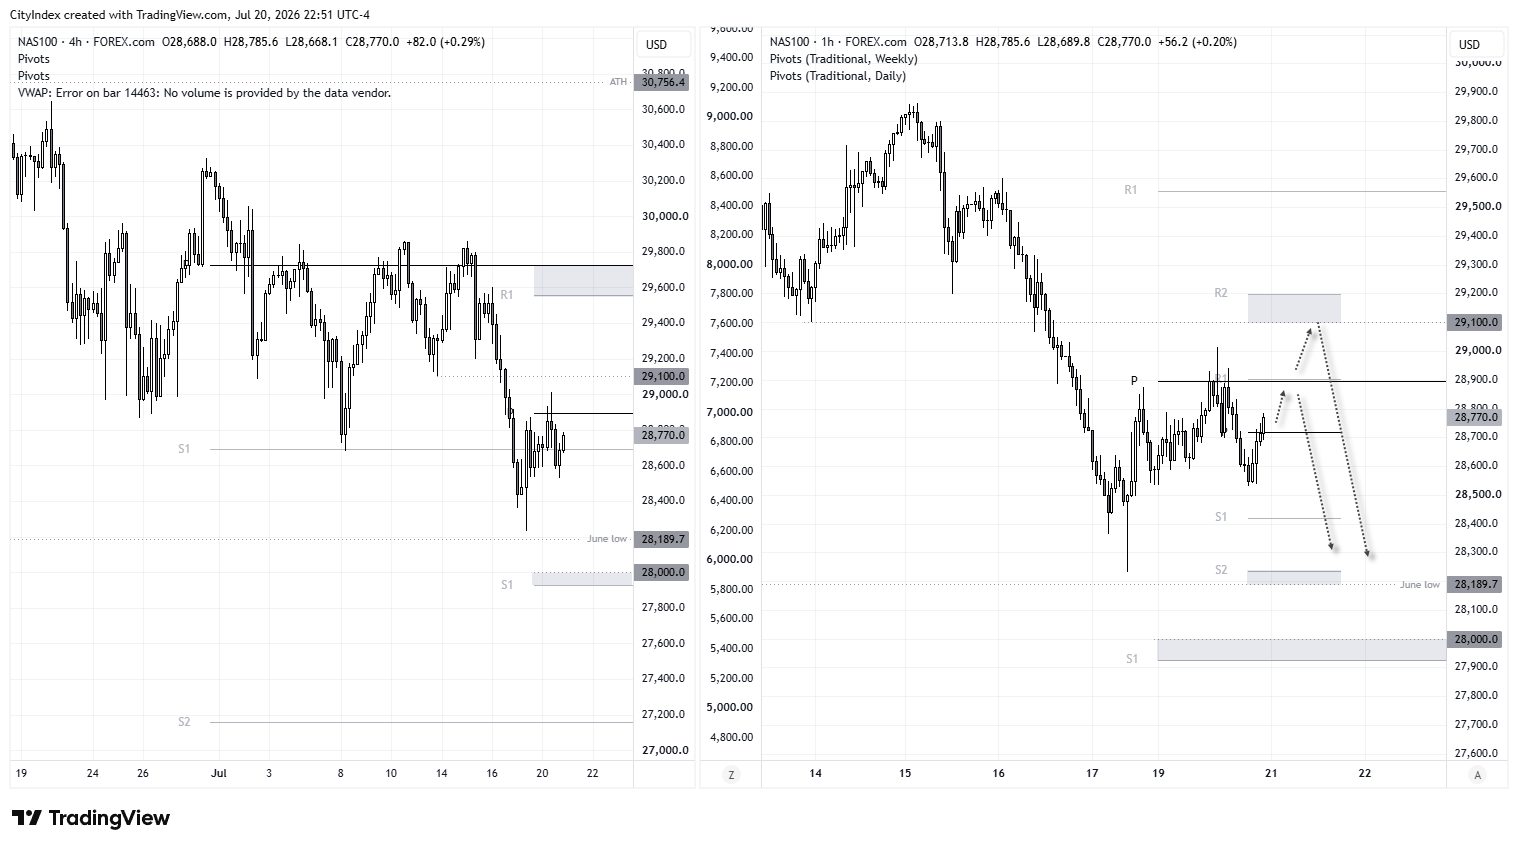
Momentum has been moving predominantly lower on the 4-hour chart, although prices are grinding higher as part of a countertrend move. If the Nasdaq breaks above its weekly pivot point and the daily R1 near 28,900, the 29,100 low and weekly R2 pivot come into view. This could provide a potential resistance zone for bears to fade into or look for evidence of a swing high, on the assumption another leg lower unfolds. The June low could then come back into focus, with a break below it suggesting a deeper pullback is underway.
Risks to my downside bias include stronger-than-expected earnings and a solid rebound in the KOSPI.
Source: Forex.com, TradingView
View the full economic calendar
View the full economic calendar
-- Written by Matt Simpson
Follow Matt on Twitter @cLeverEdge
How to trade with City Index
You can trade with City Index by following these four easy steps:
- Open an account, or log in if you’re already a customer
• Open an account in the UK
• Open an account in Australia
• Open an account in Singapore
- Search for the market you want to trade in our award-winning platform
- Choose your position and size, and your stop and limit levels
- Place the trade
Related tags:


Open an account in minutes
Experience award-winning platforms with fast and secure execution.
Economic calendar
Web Trader platform
Our sophisticated web-based platform is packed with features.
Related articles
China's steel slump leaves iron ore bulls under the pump
Iron ore has broken major support, threatening a return to the lows of 2022 as mounting evidence of weakness in China's steel sector reinforces the bearish outlook.

USD/JPY, AUD/JPY: Central Bank Divergence Creates Two-Way Risk
USD/JPY eyes a breakout above 160, while AUD/JPY faces further losses as Fed, RBA and BoJ interest rate expectations diverge.

S&P, Nasdaq Slide as NVDA, AI Worries Continue to Build
It was a busy weekend in the headlines as a campaign to bring back Jensen Huang atop NVDA gained steam, even with accusations of possible treason and a circular funding model that has started to raise questions.

StoneX Financial Ltd (trading as "FOREX.com") is an execution-only service provider. This material, whether or not it states any opinions, is for general information purposes only and it does not take into account your personal circumstances or objectives. This material has been prepared using the thoughts and opinions of the author and these may change. However, FOREX.com does not plan to provide further updates to any material once published and it is not under any obligation to keep this material up to date.
This material is short term in nature and may only relate to facts and circumstances existing at a specific time or day. Nothing in this material is (or should be considered to be) financial, investment, legal, tax or other advice and no reliance should be placed on it. No opinion given in this material constitutes a recommendation by FOREX.com or the author that any particular investment, security, transaction or investment strategy is suitable for any specific person.
The material has not been prepared in accordance with legal requirements designed to promote the independence of investment research. Although FOREX.com is not specifically prevented from dealing before providing this material, FOREX.com does not seek to take advantage of the material prior to its dissemination. This material is not intended for distribution to, or use by, any person in any country or jurisdiction where such distribution or use would be contrary to local law or regulation. For further details see our full non-independent research disclaimer and quarterly summary.