



Nvidia’s (NVDA) near-60% rally could struggle at this resistance zone
Nvidia (NVDA) shares may have rallied 2.7% after their Q3 earnings report, but we’re less convinced it can break above a strong resistance area (initially at least).
Share this:

Nvidia shares rose 2.7% during after-market trade thanks to strong data-centre demand helping them beat analysts Q3 revenue expectations. Earlier in the day they also announced a partnership with Microsoft to build an AI super computer. However, their EPS (earnings per share) was a miss and Q4 revenue guidance was also slightly lower than expected.
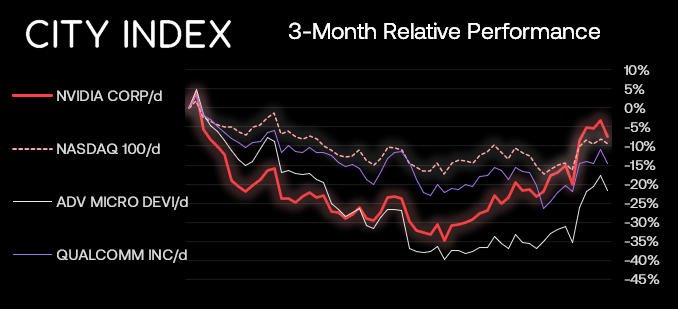
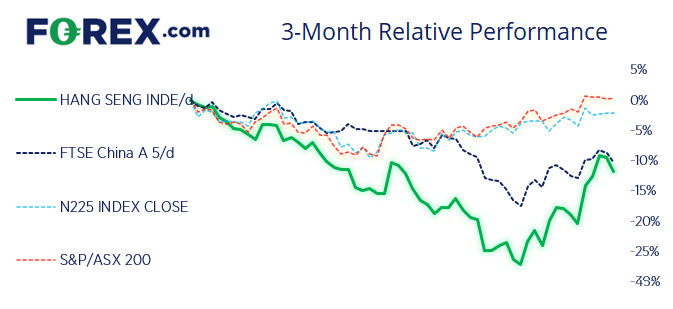
Nvidia (NVDA): Bear market rally or new bullish trend?
The tech stock peaked in November 2021 at 346.47 and managed to fall nearly 70% over the next 11 months, so its bear trend is more than established. Yet in the past month it has recovered an impressive 57.2%, and that makes us wonder whether this is the beginning of a much larger bull trend, or simply a tease of a bear-market bounce.
I’m happy to let the longer-term investors argue that one over, but I do know that we’re heading into 2023 with a Republican House and Democrat Senate, which means we’re less likely to see inflationary policies make their way over the line (good news to equity traders). But we’re also likely to be seeing much lower growth in 2023 and 2024, and cracks are appearing in the US employment sector data – and many big tech companies have announced layoffs or restructuring plans.
NVIDIA daily chart:
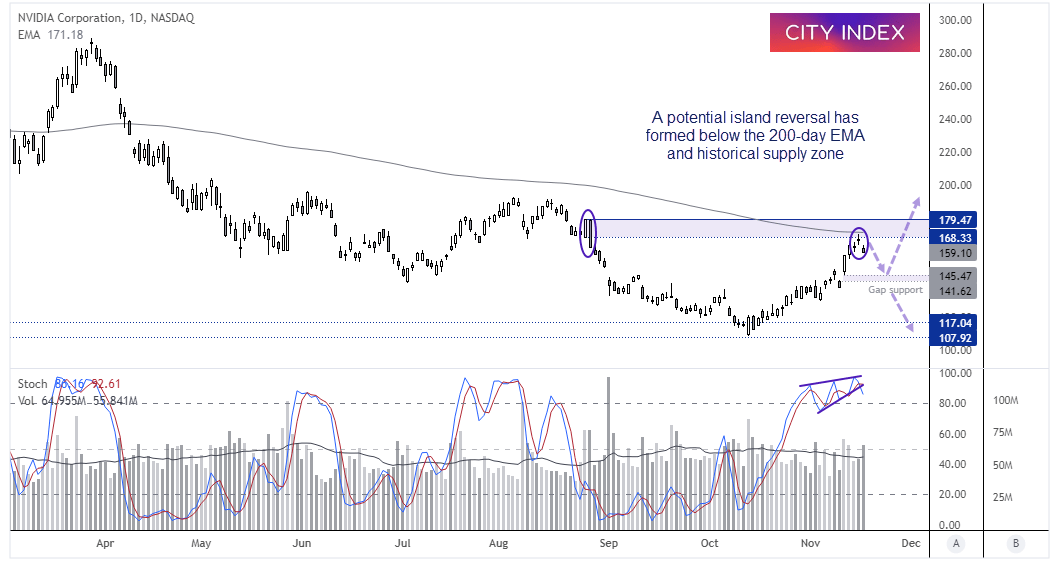
From a technical perspective, I suspect NVIDIA has posted a cycle top. Its rally stalled just below the 200-day EMA, which is a tough mut to crack. A small Doji formed at the cycle high, which is part of a 3-bar reversal called an Island reversal pattern. Furthermore, the reversal pattern is just beneath the prior peak which included a strong 2-bar reversal (and therefore a strong supply zone). Volume was also above average yesterday ahead of earnings and the stochastic oscillator is overbought, which itself is showing signs that it also wants to top out.
- The stock rallied over 2% during after-market hours, but that could allows bears to short at a more favourable prices (assuming resistance holds).
- Bears could enter short below the 200-day EMA with a stop above the 179.47 high.
- Gap support around 141.62 – 145.47 makes a viable downside target which can be trailed along the way.
- As price action unfolds, we may have a better idea as to whether it is a retracement against a much larger bullish move, or the market has returned to the long-term bear trend.
How to trade with City Index
You can easily trade with City Index by using these four easy steps:
- Open an account, or log in if you’re already a customer
• Open an account in the UK
• Open an account in Australia
• Open an account in Singapore
- Search for the company you want to trade in our award-winning platform
- Choose your position and size, and your stop and limit levels
- Place the trade
How to trade with FOREX.com
Follow these easy steps to start trading with FOREX.com today:
- Open a Forex.com account, or log in if you’re already a customer.
- Search for the pair you want to trade in our award-winning platform.
- Choose your position and size, and your stop and limit levels.
- Place the trade.
Related tags:



Open an account in minutes
Experience award-winning platforms with fast and secure execution.
Economic calendar
Web Trader platform
Our sophisticated web-based platform is packed with features.
Related articles
China's steel slump leaves iron ore bulls under the pump
Iron ore has broken major support, threatening a return to the lows of 2022 as mounting evidence of weakness in China's steel sector reinforces the bearish outlook.

USD/JPY, AUD/JPY: Central Bank Divergence Creates Two-Way Risk
USD/JPY eyes a breakout above 160, while AUD/JPY faces further losses as Fed, RBA and BoJ interest rate expectations diverge.

Gold and silver forecast: Precious metals extend drop but seasonality hopes keeps bullish case alive
It has been a risk off session so far today with stocks, gold and especially silver (-4%) all taking a drop. Gold has fallen to a fresh 2026 low and its now more than $100 below the psychologically important $4,000 mark. A firmer US dollar, rising US rate expectations and fading safe-haven demand have combined to undermine the metal, despite continued central bank buying. This year has so far been a bad one for gold.

StoneX Financial Ltd (trading as "FOREX.com") is an execution-only service provider. This material, whether or not it states any opinions, is for general information purposes only and it does not take into account your personal circumstances or objectives. This material has been prepared using the thoughts and opinions of the author and these may change. However, FOREX.com does not plan to provide further updates to any material once published and it is not under any obligation to keep this material up to date.
This material is short term in nature and may only relate to facts and circumstances existing at a specific time or day. Nothing in this material is (or should be considered to be) financial, investment, legal, tax or other advice and no reliance should be placed on it. No opinion given in this material constitutes a recommendation by FOREX.com or the author that any particular investment, security, transaction or investment strategy is suitable for any specific person.
The material has not been prepared in accordance with legal requirements designed to promote the independence of investment research. Although FOREX.com is not specifically prevented from dealing before providing this material, FOREX.com does not seek to take advantage of the material prior to its dissemination. This material is not intended for distribution to, or use by, any person in any country or jurisdiction where such distribution or use would be contrary to local law or regulation. For further details see our full non-independent research disclaimer and quarterly summary.