





Should Traders Buy the Dip That Depends on Policymakers
A strong response from global policymakers may be the sign traders need to see for equity markets to form a bottom...
Share this:

US Dollar Outlook: USD/JPY
USD/JPY appears to be stuck in a defined range even as US JOLTS Job Openings climbs to 8.04M in August from 7.71M the month prior, but the ongoing shift in the carry trade may continue to influence the exchange rate as the Federal Reserve plans to further unwind its restrictive policy.
USD/JPY Outlook Mired by Negative Slope in 50-Day SMA
USD/JPY holds below the 50-Day SMA (145.69) following the failed attempt to test the September high (147.21), and it remains to be seen if the exchange rate will track the negative slope in the moving average as Fed Chairman Jerome Powell acknowledges that ‘if the economy evolves broadly as expected, policy will move over time toward a more neutral stance.’
Join David Song for the Weekly Fundamental Market Outlook webinar. David provides a market overview and takes questions in real-time. Register Here
Nevertheless, Chairman Powell insists that ‘we are not on any preset course’ while speaking at the National Association for Business Economics, with the official going onto say that ‘this is not a committee that feels like it’s in a hurry to cut rates quickly.’
With that said, USD/JPY may face range bound conditions as recent remarks from Chairman Powell curb speculation for another 50bp rate cut, but swings in the carry trade may continue to impact the exchange rate as major central banks implement lower interest rates.
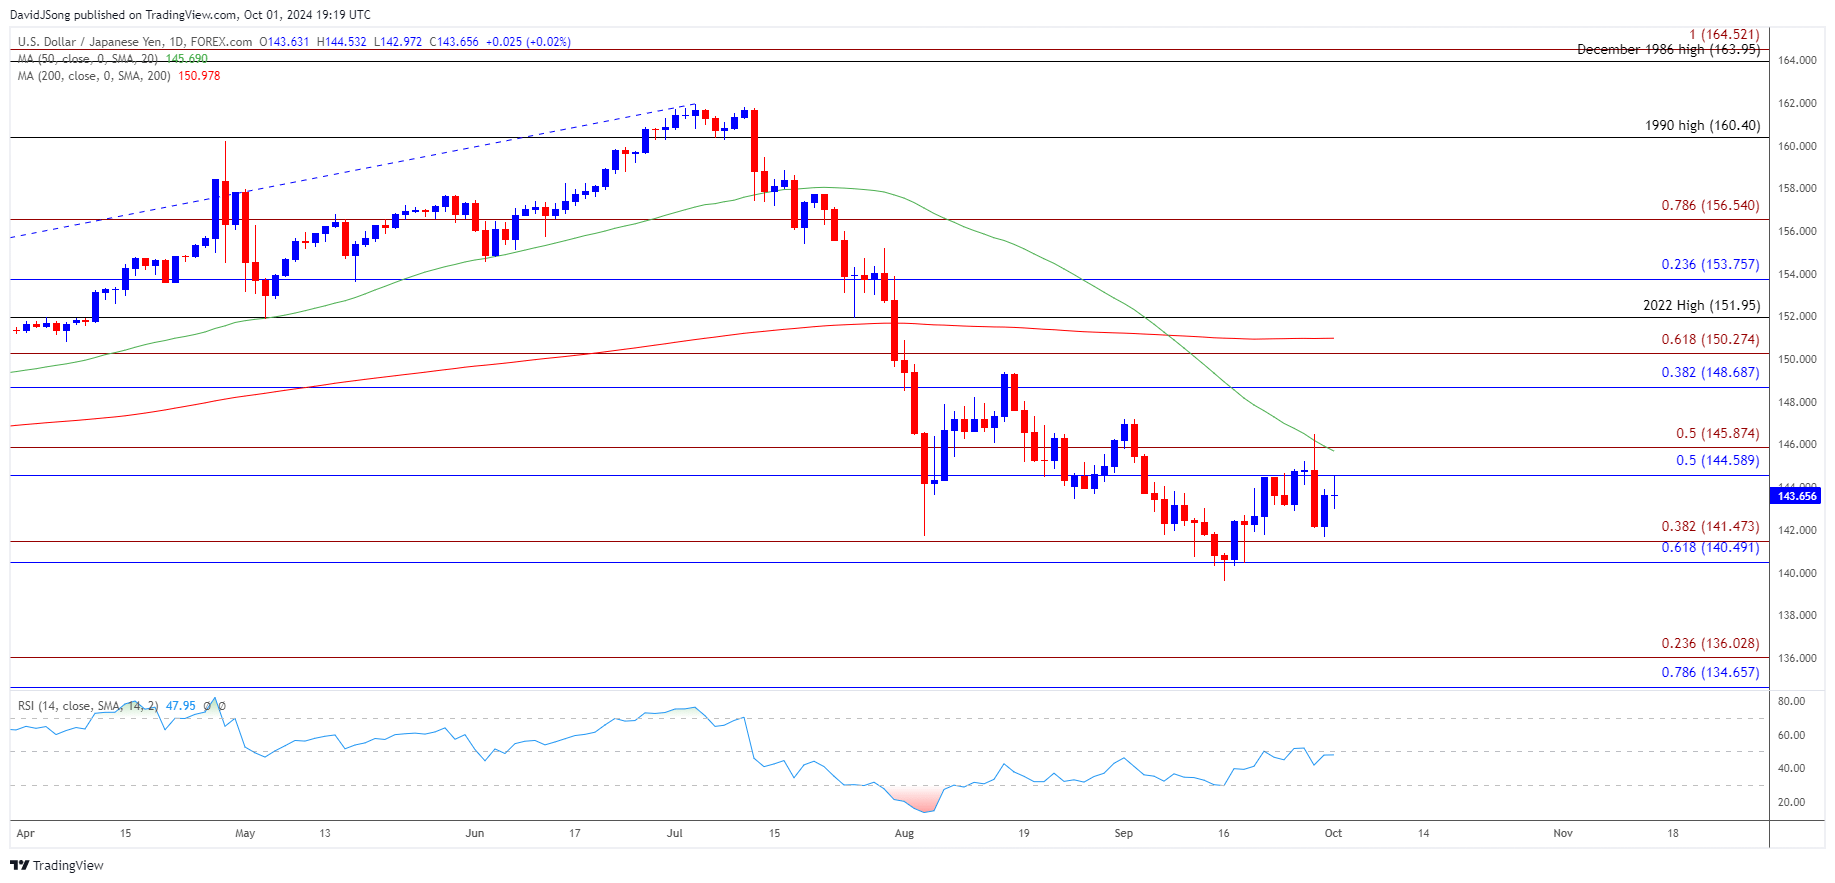
USD/JPY Price Chart – Daily
Chart Prepared by David Song, Strategist; USD/JPY on TradingView
- Keep in mind, the recent recovery in USD/JPY emerged following the failed attempts to close below the 140.50 (61.8% Fibonacci retracement) to 141.50 (38.2% Fibonacci extension) zone, and the exchange rate may further retrace the decline from the September high (147.21) as it extends the advance from the start of the week.
- However, lack of momentum to close above the 144.60 (50% Fibonacci retracement) to 145.90 (50% Fibonacci extension) region may keep USD/JPY within the September range, and the exchange rate may track sideways if it largely ignores the negative slope in the 50-Day SMA (145.69).
- Meanwhile, a close below the 140.50 (61.8% Fibonacci retracement) to 141.50 (38.2% Fibonacci extension) zone may push USD/JPY towards the July 2023 low (137.24), with the next region of interest coming in around 134.70 (78.6% Fibonacci retracement) to 136.00 (23.6% Fibonacci extension).
--- Written by David Song, Senior Strategist
Follow on Twitter at @DavidJSong




Open an account in minutes
Experience award-winning platforms with fast and secure execution.
Economic calendar
Web Trader platform
Our sophisticated web-based platform is packed with features.
Related articles

Nikkei swings harder than Nasdaq as AI fears deepen
Nikkei 225 volatility is running well ahead of Nasdaq 100, with the index construction and Japan's heavy exposure to AI manufacturing potentially explaining the difference.

S&P 500, Nasdaq 100 Claw Back But NVDA Cloud Looms Overhead
Last week was green for both the Nasdaq and S&P 500 but given the sell-off that led into that bounce there’s still a very real question as to whether bears still have a statement to make. And the NVDA situation presents a very real threat.


AUD/USD Outlook: Historic yield squeeze leaves Aussie bears in control
Australian bond yields have fallen below their US equivalents as the Fed's hawkish repricing gathers momentum. With the Aussie weakening broadly, technical signals suggest sellers remain in control.
StoneX Financial Ltd (trading as "FOREX.com") is an execution-only service provider. This material, whether or not it states any opinions, is for general information purposes only and it does not take into account your personal circumstances or objectives. This material has been prepared using the thoughts and opinions of the author and these may change. However, FOREX.com does not plan to provide further updates to any material once published and it is not under any obligation to keep this material up to date.
This material is short term in nature and may only relate to facts and circumstances existing at a specific time or day. Nothing in this material is (or should be considered to be) financial, investment, legal, tax or other advice and no reliance should be placed on it. No opinion given in this material constitutes a recommendation by FOREX.com or the author that any particular investment, security, transaction or investment strategy is suitable for any specific person.
The material has not been prepared in accordance with legal requirements designed to promote the independence of investment research. Although FOREX.com is not specifically prevented from dealing before providing this material, FOREX.com does not seek to take advantage of the material prior to its dissemination. This material is not intended for distribution to, or use by, any person in any country or jurisdiction where such distribution or use would be contrary to local law or regulation. For further details see our full non-independent research disclaimer and quarterly summary.