




Texas Instruments eyeing another new all time high
Texas Instruments medium-term bullish trend remains intact.
Share this:

Texas Instruments (TXN)
click to enlarge charts
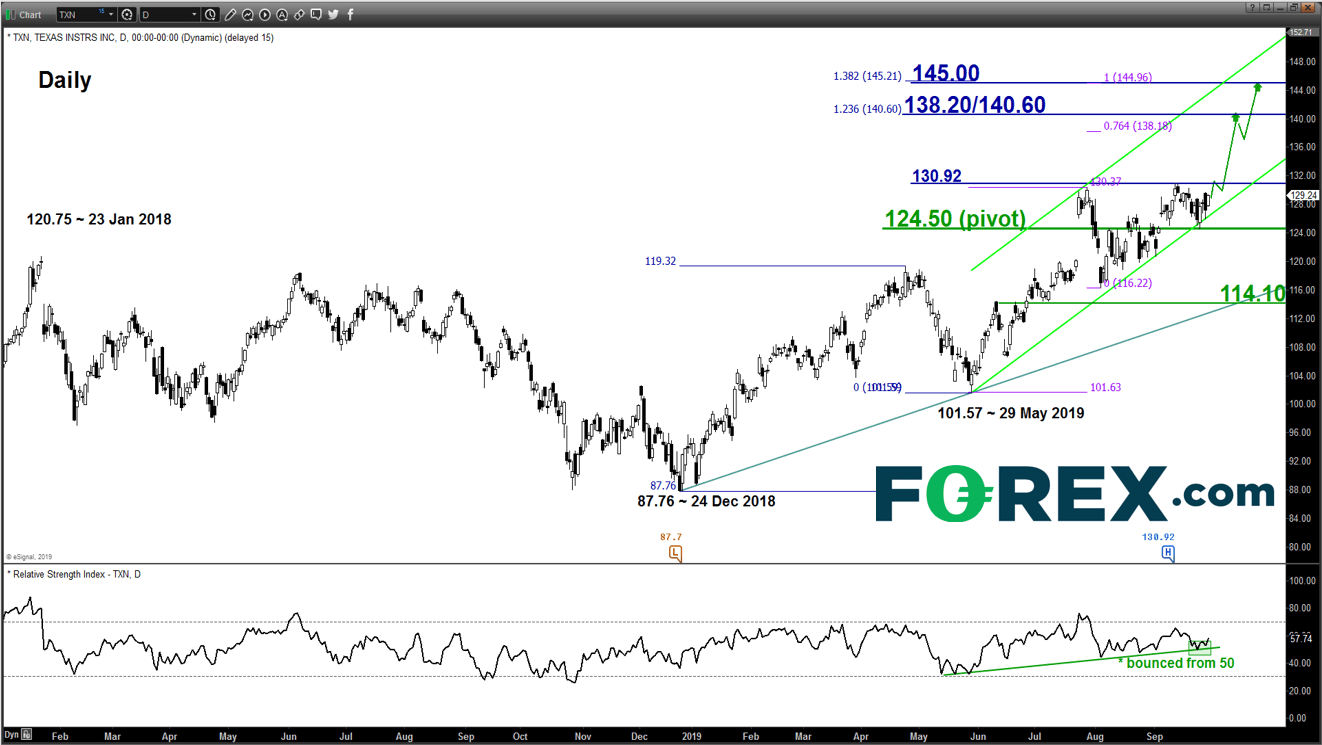
Key Levels (1 to 3 weeks)
Pivot (key support): 124.50
Resistances: 130.92, 138.20/140.60 & 145.00
Next support: 114.10
Directional Bias (1 to 3 weeks)
Texas Instruments, a diversified semiconductor firm that supplies to a broad range of industries from automakers, telecommunications to consumer electronics and it is also the 2nd biggest weightage component stock in the PHLX Semiconductor Sector Index.
Its share price is now exhibiting positive technical elements where it may surge above its current all-time high level of 130.92 printed on 12 Sep 2019. Bullish bias above the 124.50 key medium-term pivotal support for a further potential up move to target the next resistance at 138.20/140.60 and a clearance above 140.60 sees a further rally towards 145.00 next.
On the other hand, a break with a daily close below 124.50 invalidates the impulsive up move scenario for a corrective decline to test a major support at 114.10 (also the ascending trendline from 24 Dec 2018 low).
Key elements
- TXN has continued to evolve within a medium-term ascending channel in place since 29 May 2019 with the lower boundary of the ascending channel acting a support at 124.50.
- The upper boundary of the aforementioned ascending channel stands at 145.00 which is also defined by a Fibonacci expansion cluster.
- The daily RSI oscillator has managed to stage a rebound from a corresponding ascending support in place since 29 May 2019 low and the 50 level. This observation suggests a revival of medium-term upside momentum.
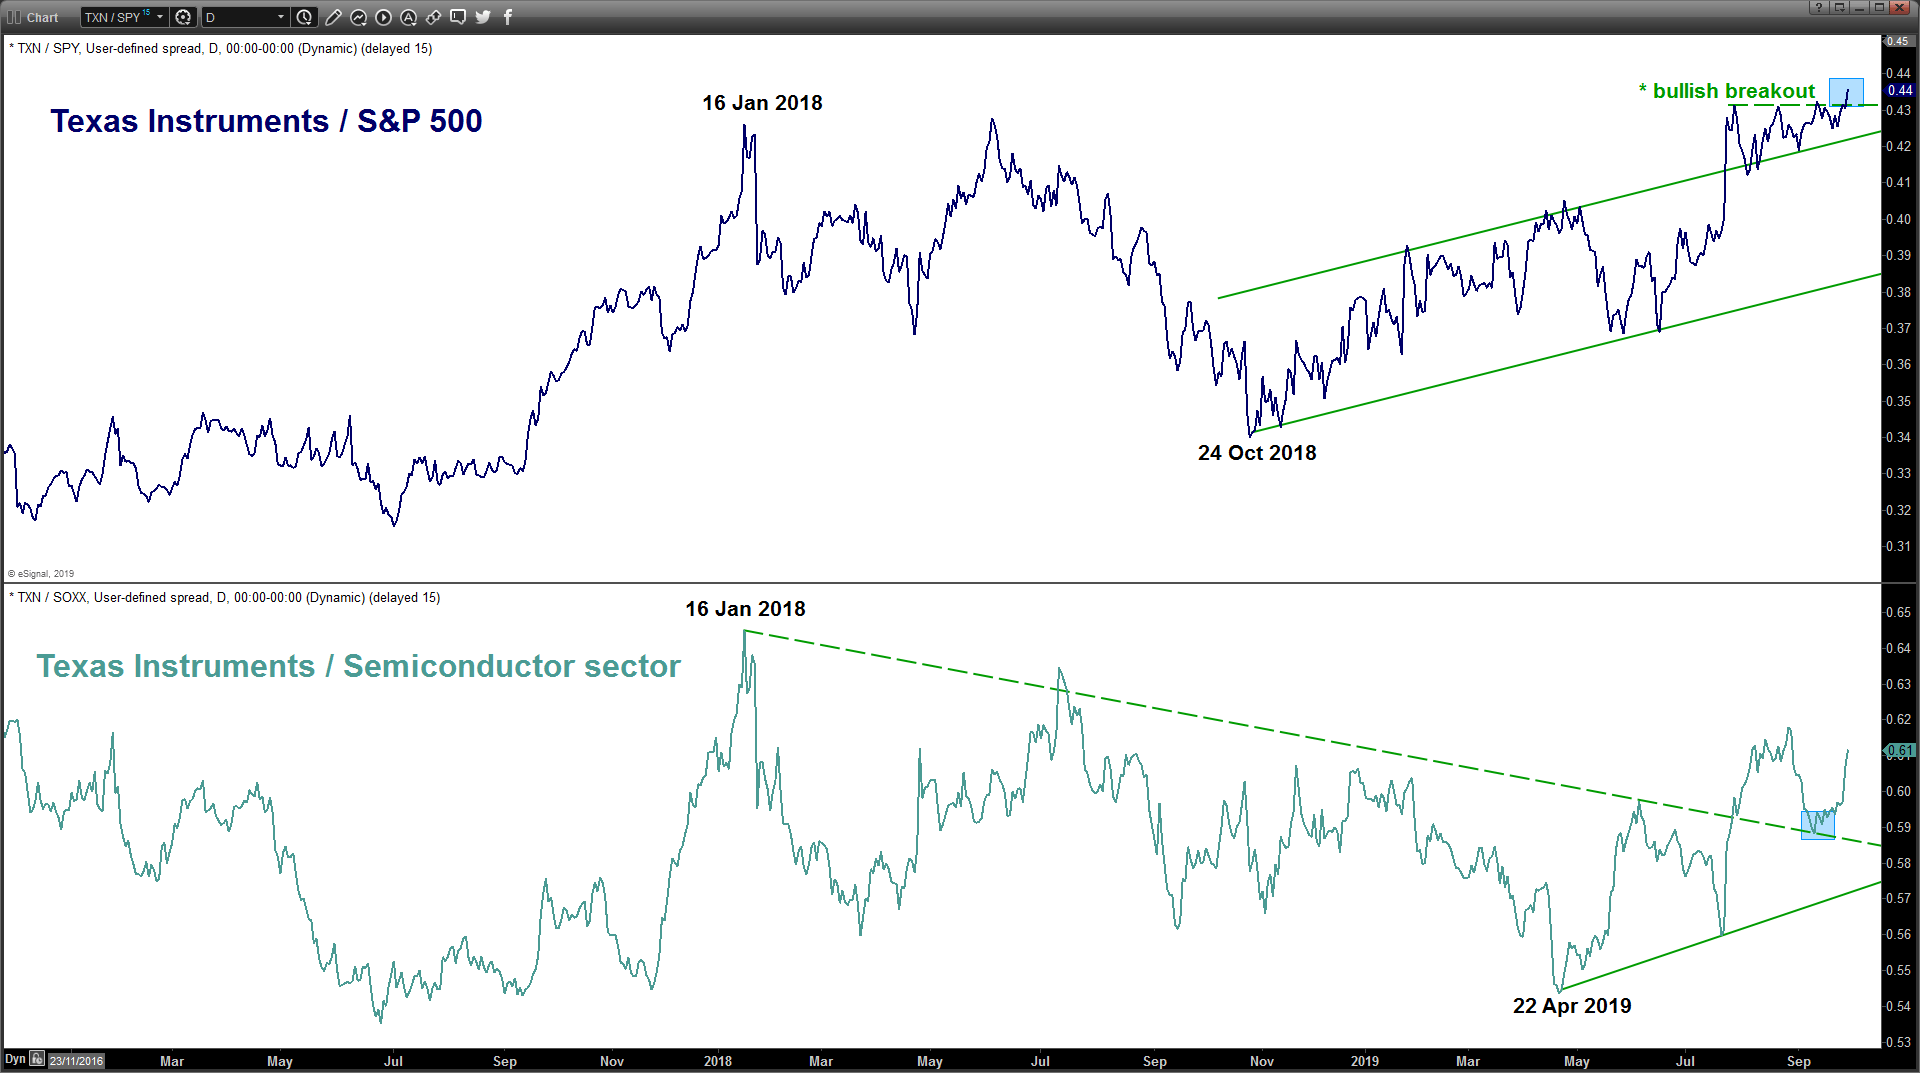
- Relative strength analysis against the market (S&P 500) and its sector (Semiconductor) from the respective ratio charts are suggesting further potential outperformance of TXN.
Charts are from eSignal
Texas Instruments (TXN)
click to enlarge charts
Key Levels (1 to 3 weeks)
Pivot (key support): 124.50
Resistances: 130.92, 138.20/140.60 & 145.00
Next support: 114.10
Directional Bias (1 to 3 weeks)
Texas Instruments, a diversified semiconductor firm that supplies to a broad range of industries from automakers, telecommunications to consumer electronics and it is also the 2nd biggest weightage component stock in the PHLX Semiconductor Sector Index.
Its share price is now exhibiting positive technical elements where it may surge above its current all-time high level of 130.92 printed on 12 Sep 2019. Bullish bias above the 124.50 key medium-term pivotal support for a further potential up move to target the next resistance at 138.20/140.60 and a clearance above 140.60 sees a further rally towards 145.00 next.
On the other hand, a break with a daily close below 124.50 invalidates the impulsive up move scenario for a corrective decline to test a major support at 114.10 (also the ascending trendline from 24 Dec 2018 low).
Key elements
- TXN has continued to evolve within a medium-term ascending channel in place since 29 May 2019 with the lower boundary of the ascending channel acting a support at 124.50.
- The upper boundary of the aforementioned ascending channel stands at 145.00 which is also defined by a Fibonacci expansion cluster.
- The daily RSI oscillator has managed to stage a rebound from a corresponding ascending support in place since 29 May 2019 low and the 50 level. This observation suggests a revival of medium-term upside momentum.
- Relative strength analysis against the market (S&P 500) and its sector (Semiconductor) from the respective ratio charts are suggesting further potential outperformance of TXN.
Charts are from eSignal
Related tags:
Latest market news




Open an account in minutes
Experience award-winning platforms with fast and secure execution.
Economic calendar
Web Trader platform
Our sophisticated web-based platform is packed with features.
Related articles

S&P 500, Nasdaq 100 Claw Back But NVDA Cloud Looms Overhead
Last week was green for both the Nasdaq and S&P 500 but given the sell-off that led into that bounce there’s still a very real question as to whether bears still have a statement to make. And the NVDA situation presents a very real threat.


Nasdaq Rips, 8% Off the Lows – Are Bulls Back in Control?
The AI trade is getting a push this morning following the earnings results from Coreweave, and with the Nasdaq already up more than 8% from last week’s lows the big question is whether a low is in place.

S&P 500 Update: SPX Records Its Biggest Selloff of the Year Ahead of NFP
The trading week has not been particularly favorable for risk appetite in the short term, and this is now becoming increasingly evident in the performance of the S&P 500. During today's session, the index is down nearly 4.2%, marking its largest intraday decline of 2026.

StoneX Financial Ltd (trading as "FOREX.com") is an execution-only service provider. This material, whether or not it states any opinions, is for general information purposes only and it does not take into account your personal circumstances or objectives. This material has been prepared using the thoughts and opinions of the author and these may change. However, FOREX.com does not plan to provide further updates to any material once published and it is not under any obligation to keep this material up to date.
This material is short term in nature and may only relate to facts and circumstances existing at a specific time or day. Nothing in this material is (or should be considered to be) financial, investment, legal, tax or other advice and no reliance should be placed on it. No opinion given in this material constitutes a recommendation by FOREX.com or the author that any particular investment, security, transaction or investment strategy is suitable for any specific person.
The material has not been prepared in accordance with legal requirements designed to promote the independence of investment research. Although FOREX.com is not specifically prevented from dealing before providing this material, FOREX.com does not seek to take advantage of the material prior to its dissemination. This material is not intended for distribution to, or use by, any person in any country or jurisdiction where such distribution or use would be contrary to local law or regulation. For further details see our full non-independent research disclaimer and quarterly summary.