



USD/JPY Ascending Triangle, but is 160 Vulnerable?
USD/JPY continues to catch bids after pullbacks with today showing another example following last week’s pullback to 157.50. This keeps in-line an ascending triangle formation.
Share this:

USD/JPY Talking Points:
- USD/JPY volatility has quieted over the past month following the steep sell-off from the 160.00 handle.
- Since then, 159.00 has functioned as resistance but bulls haven’t been too deterred, continually showing up after pullbacks at higher-lows.
- This sets the stage for tension, with that 159 level as resistance and the 160 level the bigger spot sitting overhead.
While the FX fireworks have been elsewhere of late, USD/JPY remains structurally clean, and as I looked at in last week’s webinar I think the pair is one of the more attractive backdrops for items of USD-strength. That said, the market is not without its own drama as the 160.00 level that evoked comments from both Katayama in Japan and Bessent in the US sits just above current resistance at the 159.00 handle.
That 159.00 level had a bit of verbal defense, as well, but the reaction to that wasn’t nearly as stark as what had showed a month earlier when USD/JPY fell by more than 700 pips after venturing above the 160.00 handle. And, of course, the 164.00 level looms large as this was the spot that was actually defended by a real intervention, rather than just threats like the 160 and then 159 levels.
But perhaps more to the point, talk is cheap, and fundamentals remain tilted to the long side of the pair as US inflation is higher than that of Japan and even with the BoJ talking up rate hikes, the Fed has a harder road ahead given that expectation for continued high inflation.
This is why, despite the best efforts from economic policymakers on both sides of the pair, USD/JPY has tended towards bullish structure, such as we see today. From the daily chart you can see multiple underside wicks, each reflecting a response from buyers to pullbacks. We had one such scenario last Thursday, with bulls responding just above the 157.50 level, and that gave a higher-low on Friday and, again, this Monday.
USD/JPY Daily Chart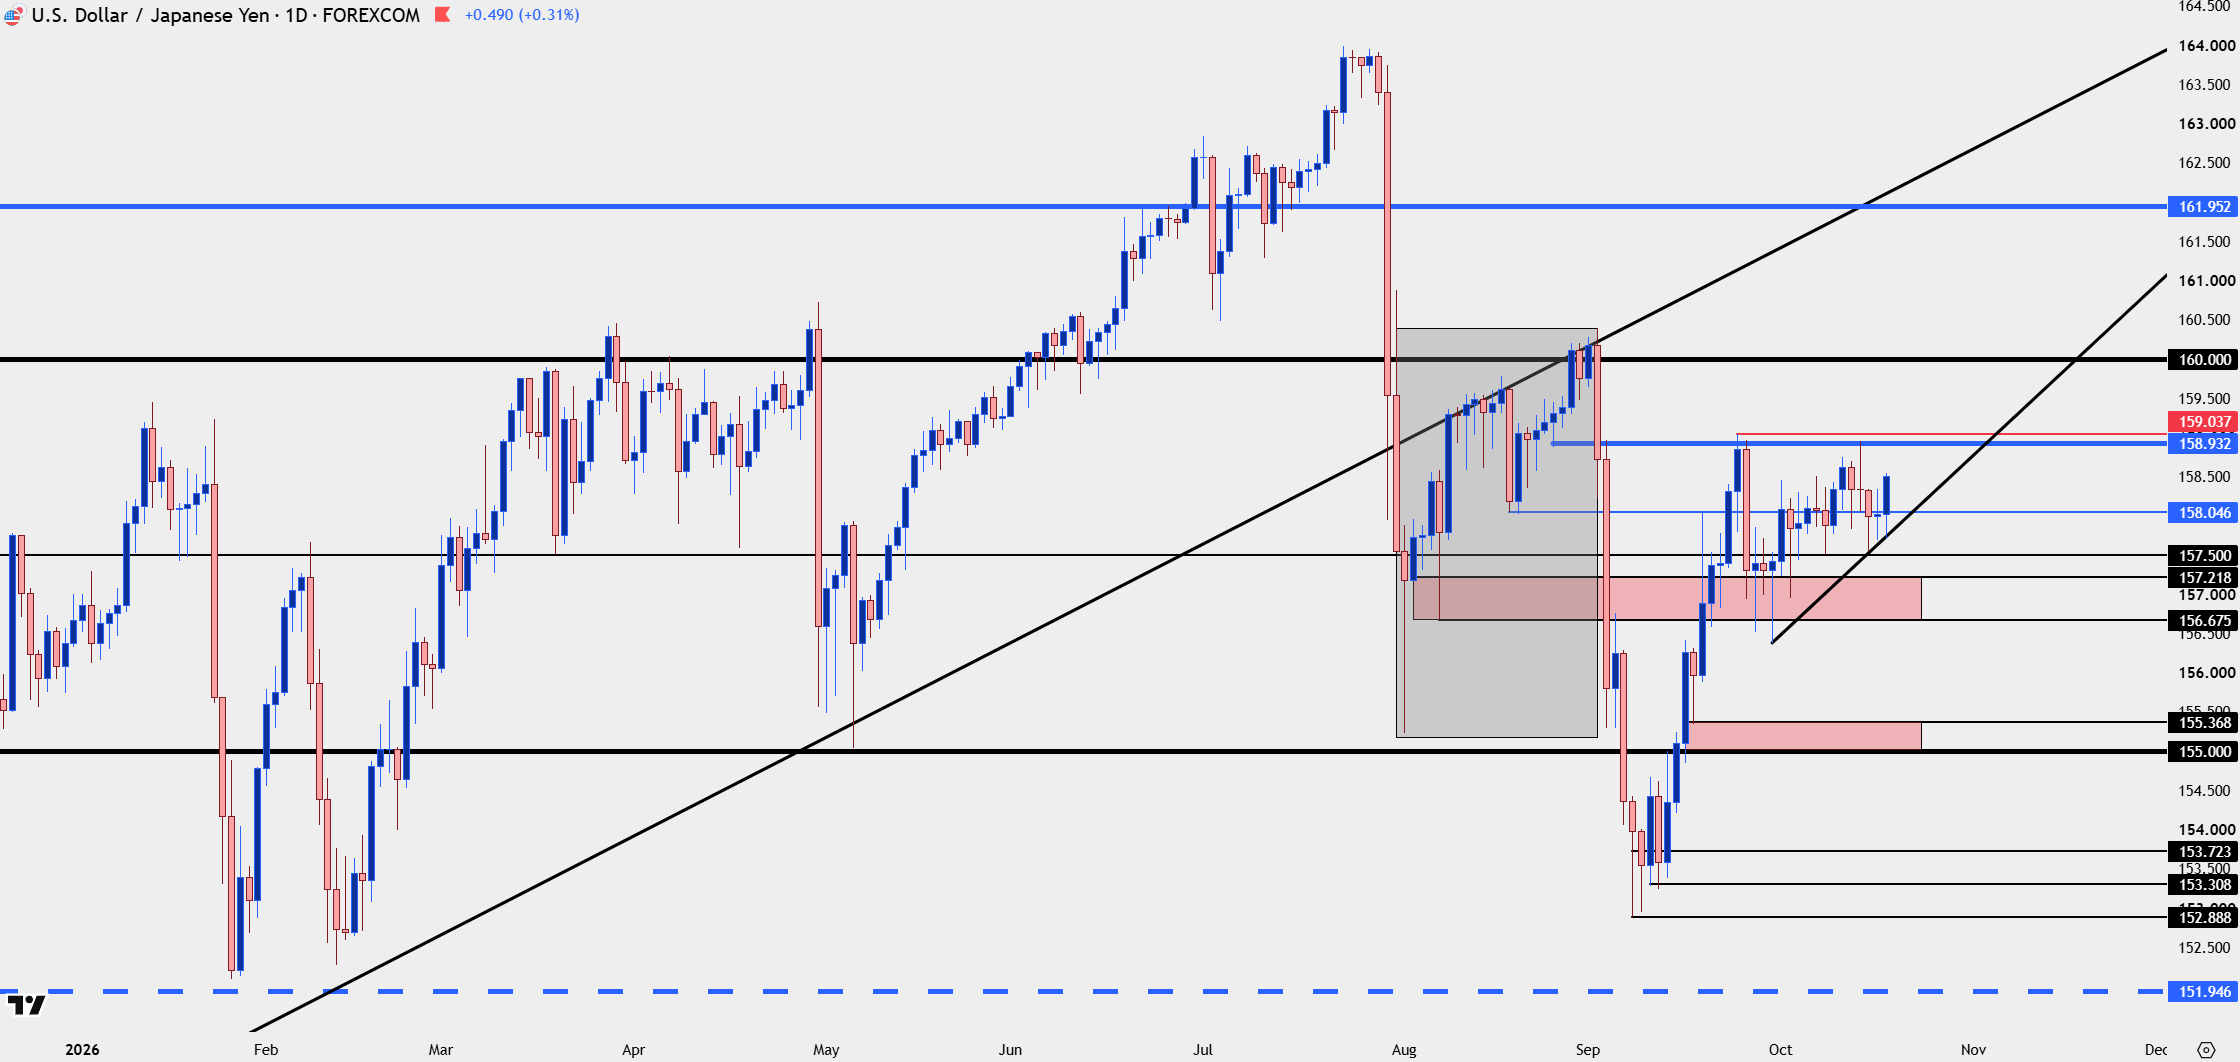
Chart prepared by James Stanley; data derived from Tradingview
USD/JPY Longer-Term
At this point we’ve seen action at 164 but only posturing below, and given how long buyers have hung around, this could spell for an eventual test until some type of action takes place from policymakers. I’d still be careful chasing breakouts over the 160 handle, but at this stage, pullbacks and a push up to 159 could remain attractive, given that buyers have shown up in the manner that they have.
If a breakout at 160 happens, price can move fast, because there’s likely a litany of stops sitting above the big figure, and if those stops get triggered that’s a wave of demand that can create a fast move-higher. This would be similar to the April of 2024 episode, when the 151.95 level was finally broken, after which we had a direct run up to the 160.00 level.
USD/JPY Weekly Chart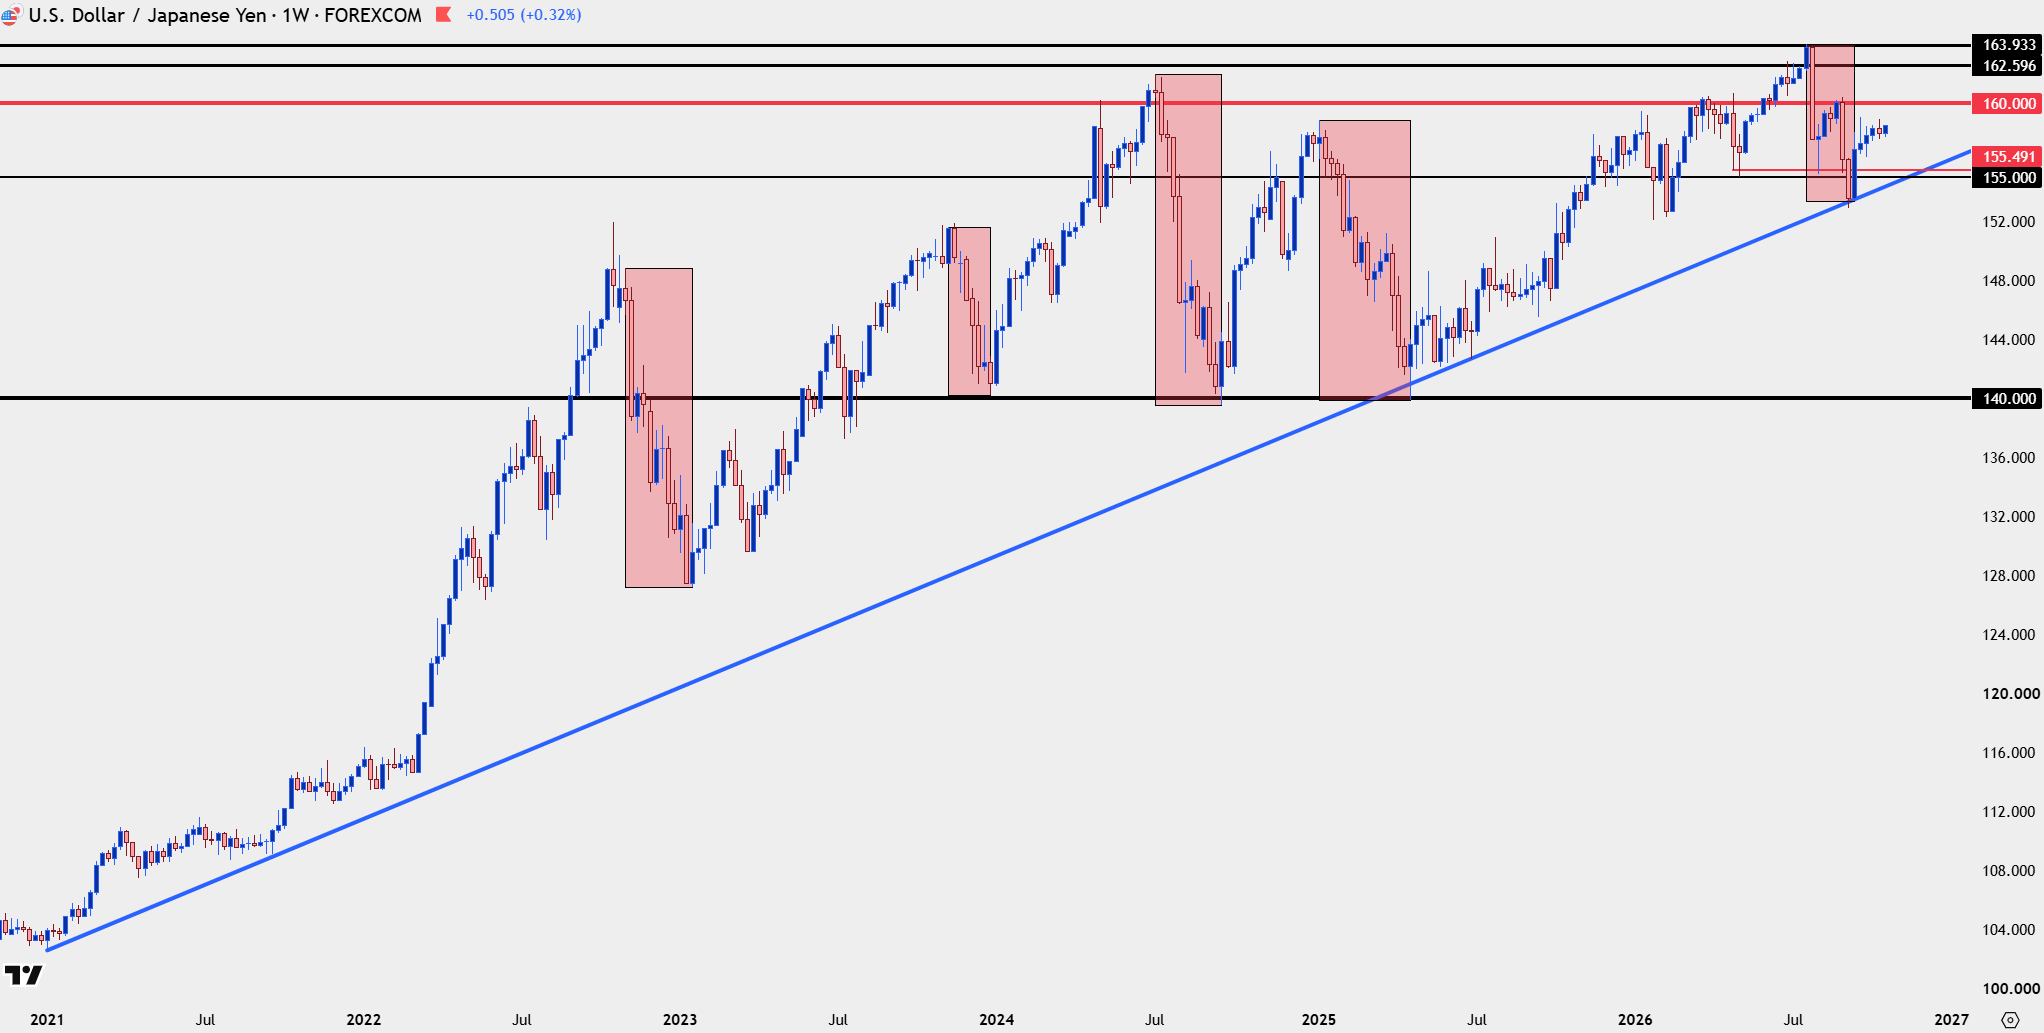
Chart prepared by James Stanley; data derived from Tradingview
--- written by James Stanley, Senior Market Analyst, Global Macro
Related tags:


Open an account in minutes
Experience award-winning platforms with fast and secure execution.
Economic calendar
Web Trader platform
Our sophisticated web-based platform is packed with features.
Related articles

USD/JPY, AUD/JPY: Central Bank Divergence Creates Two-Way Risk
USD/JPY eyes a breakout above 160, while AUD/JPY faces further losses as Fed, RBA and BoJ interest rate expectations diverge.


S&P, Nasdaq Slide as NVDA, AI Worries Continue to Build
It was a busy weekend in the headlines as a campaign to bring back Jensen Huang atop NVDA gained steam, even with accusations of possible treason and a circular funding model that has started to raise questions.

Gold, USD/JPY Forecast: Two trades to watch 161126
Gold falls to a yearly low ahead of FOMC minutes this week. USD/JPY hovers around 160 amid a stronger USD and weaker Japanese GDP.

StoneX Financial Ltd (trading as "FOREX.com") is an execution-only service provider. This material, whether or not it states any opinions, is for general information purposes only and it does not take into account your personal circumstances or objectives. This material has been prepared using the thoughts and opinions of the author and these may change. However, FOREX.com does not plan to provide further updates to any material once published and it is not under any obligation to keep this material up to date.
This material is short term in nature and may only relate to facts and circumstances existing at a specific time or day. Nothing in this material is (or should be considered to be) financial, investment, legal, tax or other advice and no reliance should be placed on it. No opinion given in this material constitutes a recommendation by FOREX.com or the author that any particular investment, security, transaction or investment strategy is suitable for any specific person.
The material has not been prepared in accordance with legal requirements designed to promote the independence of investment research. Although FOREX.com is not specifically prevented from dealing before providing this material, FOREX.com does not seek to take advantage of the material prior to its dissemination. This material is not intended for distribution to, or use by, any person in any country or jurisdiction where such distribution or use would be contrary to local law or regulation. For further details see our full non-independent research disclaimer and quarterly summary.