





USD/JPY Falls Toward 2024 Low to Push RSI into Oversold Zone
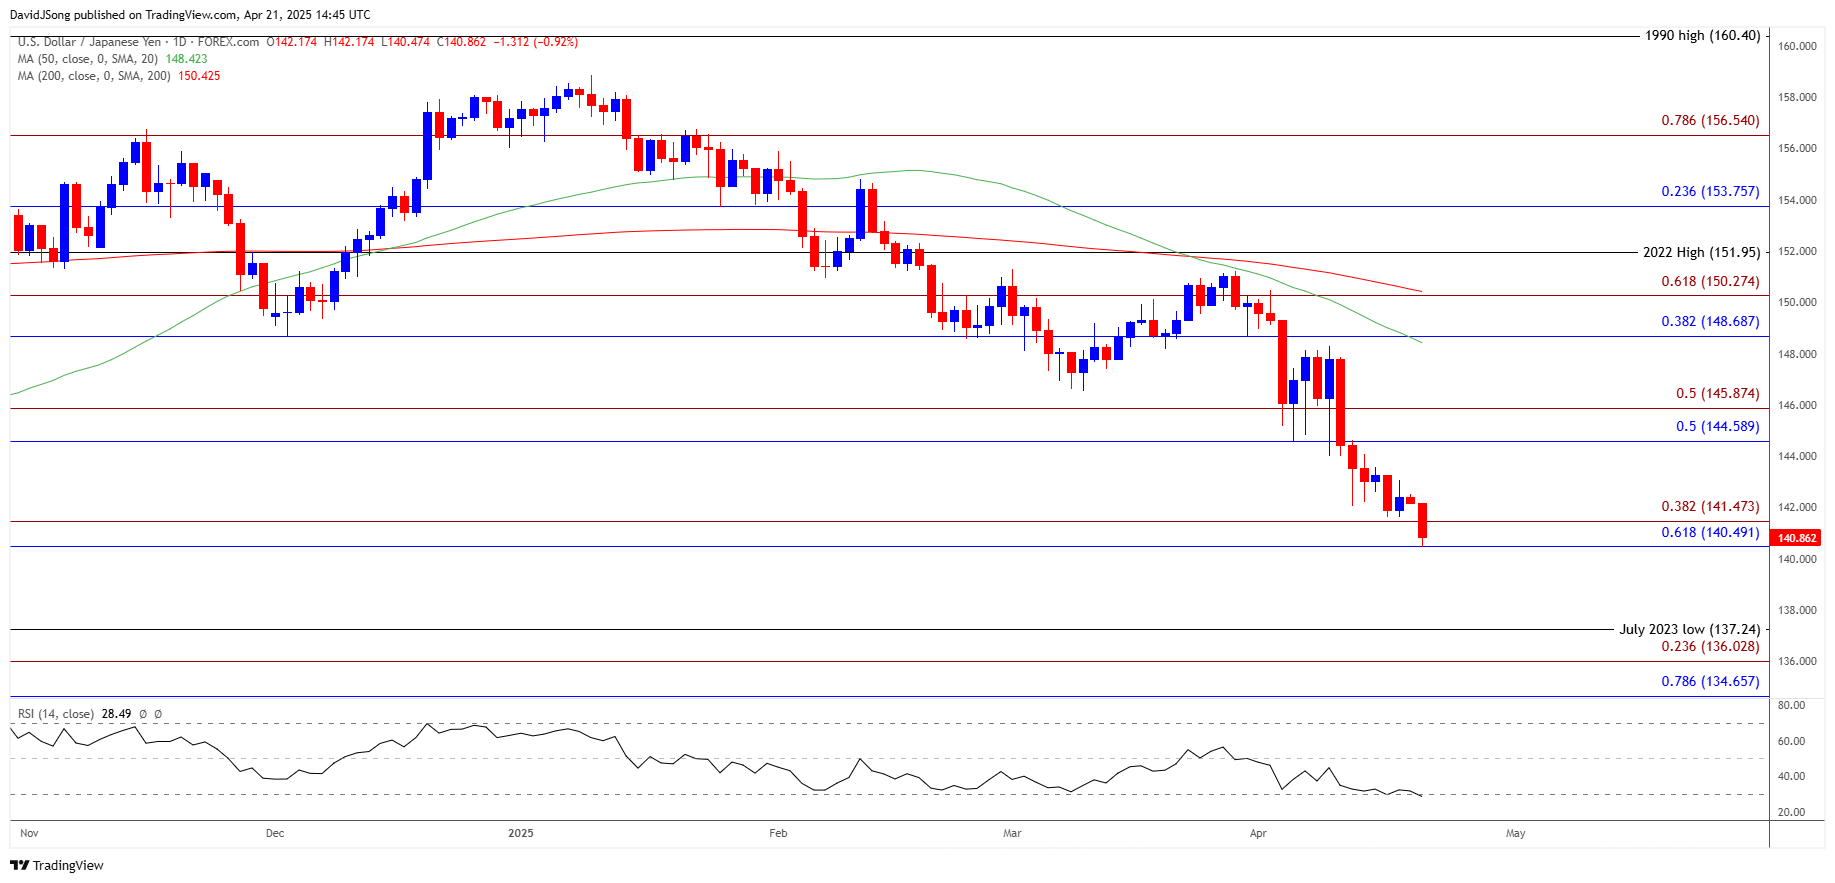
USD/JPY falls toward the 2024 low (139.58) as it slides to a fresh yearly low (140.47).
Share this:

US Dollar Outlook: USD/JPY
USD/JPY falls toward the 2024 low (139.58) as it slides to a fresh yearly low (140.47), with the weakness in the exchange rate pushing the Relative Strength Index (RSI) into oversold zone.
USD/JPY Falls Towards 2024 Low to Push RSI into Oversold Zone
USD/JPY fails to defend the rebound from last week as US President Donald Trump warns of ‘non-tariff cheating,’ and the move below 30 in the RSI is likely to be accompanied by a further decline in USD/JPY like the price action from last year.
Join David Song for the Weekly Fundamental Market Outlook webinar.
David provides a market overview and takes questions in real-time. Register Here
The ongoing shift in US trade policy may continue to drag on the Greenback as it raises the threat of a recession, and the US Dollar may face additional headwinds ahead of the Federal Reserve rate decision on May 7 as the central bank comes under pressure to further unwind its restrictive policy.
In turn, the Federal Open Market Committee (FOMC) may retain a dovish forward guidance amid signs of a slowing economy, but it seems as though the central bank is in no rush to implement lower interest rates as Chairman Jerome Powell insists that ‘we are well positioned to wait for greater clarity before considering any adjustments to our policy stance.’
With that said, the US Dollar remains susceptible to future announcements coming out of the White House as President Trump argues that ‘preemptive cuts in interest rates are being called for by many,’ but the RSI may show the bearish momentum abating should it recover from oversold territory.
USD/JPY Price Chart – Daily
Chart Prepared by David Song, Senior Strategist; USD/JPY on TradingView
- USD/JPY seems to be tracking the negative slope in the 50-Day SMA (148.42) as it continues to register fresh yearly lows, and failure to hold above the 2024 low (139.58) may push the exchange rate towards the July 2023 low (137.24).
- Next area of interest comes in around 134.70 (78.6% Fibonacci extension) to 136.00 (23.6% Fibonacci extension), but lack of momentum to close below the 140.50 (61.8% Fibonacci retracement) to 141.50 (38.2% Fibonacci extension) zone may curb the recent decline in USD/JPY.
- Need a move/close above the 144.60 (50% Fibonacci retracement) to 145.90 (50% Fibonacci extension) region to bring the 148.70 (38.2% Fibonacci retracement) to 150.30 (61.8% Fibonacci extension) zone on the radar, with the next area of interest coming in around the monthly high (150.49).
Additional Market Outlooks
Gold Bullish Price Series Keeps RSI in Overbought Territory
Euro Forecast: EUR/USD Vulnerable to RSI Sell-Signal amid ECB Rate Cut
Canadian Dollar Forecast: USD/CAD Drops as BoC Holds Interest Rate
US Dollar Forecast: USD/CHF Weakness Keeps RSI in Oversold Territory
--- Written by David Song, Senior Strategist
Follow on Twitter at @DavidJSong
Related tags:



Open an account in minutes
Experience award-winning platforms with fast and secure execution.
Economic calendar
Web Trader platform
Our sophisticated web-based platform is packed with features.
Related articles
China's steel slump leaves iron ore bulls under the pump
Iron ore has broken major support, threatening a return to the lows of 2022 as mounting evidence of weakness in China's steel sector reinforces the bearish outlook.

USD/JPY, AUD/JPY: Central Bank Divergence Creates Two-Way Risk
USD/JPY eyes a breakout above 160, while AUD/JPY faces further losses as Fed, RBA and BoJ interest rate expectations diverge.


Gold and silver forecast: Precious metals extend drop but seasonality hopes keeps bullish case alive
It has been a risk off session so far today with stocks, gold and especially silver (-4%) all taking a drop. Gold has fallen to a fresh 2026 low and its now more than $100 below the psychologically important $4,000 mark. A firmer US dollar, rising US rate expectations and fading safe-haven demand have combined to undermine the metal, despite continued central bank buying. This year has so far been a bad one for gold.

StoneX Financial Ltd (trading as "FOREX.com") is an execution-only service provider. This material, whether or not it states any opinions, is for general information purposes only and it does not take into account your personal circumstances or objectives. This material has been prepared using the thoughts and opinions of the author and these may change. However, FOREX.com does not plan to provide further updates to any material once published and it is not under any obligation to keep this material up to date.
This material is short term in nature and may only relate to facts and circumstances existing at a specific time or day. Nothing in this material is (or should be considered to be) financial, investment, legal, tax or other advice and no reliance should be placed on it. No opinion given in this material constitutes a recommendation by FOREX.com or the author that any particular investment, security, transaction or investment strategy is suitable for any specific person.
The material has not been prepared in accordance with legal requirements designed to promote the independence of investment research. Although FOREX.com is not specifically prevented from dealing before providing this material, FOREX.com does not seek to take advantage of the material prior to its dissemination. This material is not intended for distribution to, or use by, any person in any country or jurisdiction where such distribution or use would be contrary to local law or regulation. For further details see our full non-independent research disclaimer and quarterly summary.