



Will tech sell off lead to broader stocks meltdown
After Nasdaq 100’s big drop on Friday, we are watching the broader S&P 500 index for any signs of weakness in US equity markets at the start of this new trading week. So far we haven’t seen anything too bearish. But with technology sector having been the leader, Friday’s sell-off is definitely a worrying sign for the stock markets. Any further sharp falls here could spook the wider equity markets and lead to a full-blown sell-off across the major global indices. This in turn could, for example, underpin safe haven assets like gold and silver and undermine risk-sensitive FX pairs such as the USD/JPY and USD/CHF.
Share this:

After Nasdaq 100’s big drop on Friday, we are watching the broader S&P 500 index for any signs of weakness in US equity markets at the start of this new trading week. So far we haven’t seen anything too bearish. But with technology sector having been the leader, Friday’s sell-off is definitely a worrying sign for the stock markets. Any further sharp falls here could spook the wider equity markets and lead to a full-blown sell-off across the major global indices. This in turn could, for example, underpin safe haven assets like gold and silver and undermine risk-sensitive FX pairs such as the USD/JPY and USD/CHF.
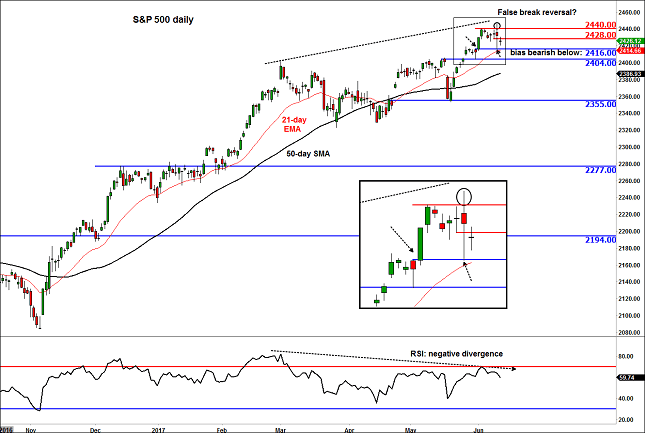
Friday’s sell-off did cause some technical damage to the S&P 500. The index’s failed attempt to break to a new high above 2440 means we may have seen a false break reversal pattern there. This pattern clearly shows that the buyers were unwilling to bid the markets any higher on Friday. If this was the turning point, then the S&P shouldn’t be able to get anywhere near this level again: for if it does then one could conclude that the selling pressure is not really that strong. Indeed, a closing break above 2428, Thursday’s low, would raise serious question marks about this potential bearish pattern.
Given the past strength of the rally, the sellers would want to see the breakdown of further support levels now, starting with the pivotal 2416 handle. This level was previously resistance and turned into support on Friday. Thus a clean break below here would suggest the selling is not done yet.
Conversely and as mentioned above a closing break above 2428 would be bullish. The bearish case would become completely invalid if the index were to break above 2440. In this case, I wouldn’t be surprised to see repeated all-time highs again until we reach levels such as 2460 and 2485.
Related tags:
Latest market news




Open an account in minutes
Experience award-winning platforms with fast and secure execution.
Economic calendar
Web Trader platform
Our sophisticated web-based platform is packed with features.
Related articles
S&P, Nasdaq Slide as NVDA, AI Worries Continue to Build
It was a busy weekend in the headlines as a campaign to bring back Jensen Huang atop NVDA gained steam, even with accusations of possible treason and a circular funding model that has started to raise questions.


S&P 500, Nasdaq 100 Claw Back But NVDA Cloud Looms Overhead
Last week was green for both the Nasdaq and S&P 500 but given the sell-off that led into that bounce there’s still a very real question as to whether bears still have a statement to make. And the NVDA situation presents a very real threat.

S&P 500 forecast: SPX struggles for direction ahead of PPI data
U.S. stocks are struggling for direction on Friday as investors continue to weigh up the fallout from Nvidia’s leadership change, rising Treasury yields and the upcoming U.S. producer price inflation data.

StoneX Financial Ltd (trading as "FOREX.com") is an execution-only service provider. This material, whether or not it states any opinions, is for general information purposes only and it does not take into account your personal circumstances or objectives. This material has been prepared using the thoughts and opinions of the author and these may change. However, FOREX.com does not plan to provide further updates to any material once published and it is not under any obligation to keep this material up to date.
This material is short term in nature and may only relate to facts and circumstances existing at a specific time or day. Nothing in this material is (or should be considered to be) financial, investment, legal, tax or other advice and no reliance should be placed on it. No opinion given in this material constitutes a recommendation by FOREX.com or the author that any particular investment, security, transaction or investment strategy is suitable for any specific person.
The material has not been prepared in accordance with legal requirements designed to promote the independence of investment research. Although FOREX.com is not specifically prevented from dealing before providing this material, FOREX.com does not seek to take advantage of the material prior to its dissemination. This material is not intended for distribution to, or use by, any person in any country or jurisdiction where such distribution or use would be contrary to local law or regulation. For further details see our full non-independent research disclaimer and quarterly summary.