




WTI Spikes as EIA Reports Large Draw
All the negative news lately made the perfect setting for a short squeeze today
Share this:

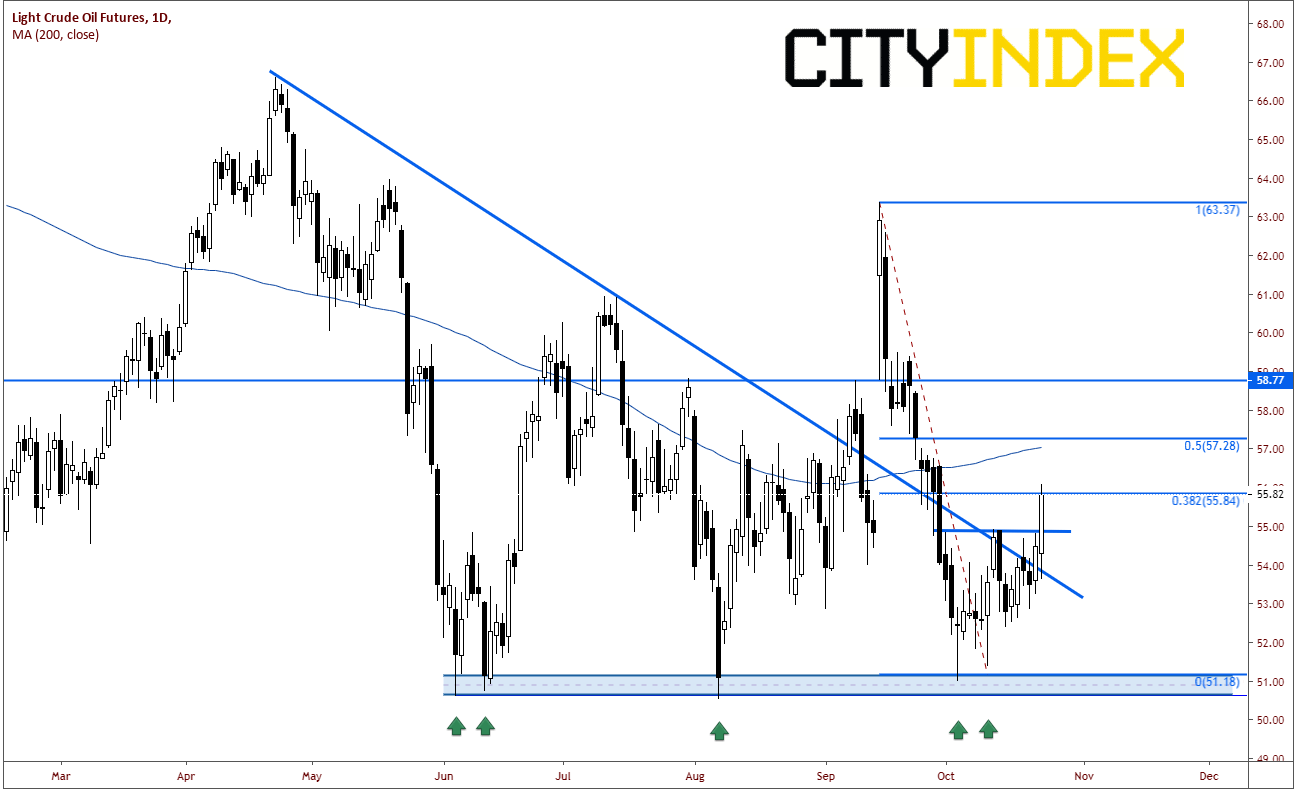
West Texas Oil futures were up 2.40% today near $55.82 after the EIA (Energy Information Administration) reported a surprise draw in crude inventories last week. The EIA reported a draw of -1.699M barrels vs a 2.232M expected, and 9.281M the prior week. Crude has been getting battered lately due to fear of the less demand from the global slowdown and the China-US trade war. In addition, yesterday’s API Weekly Crude Oil Stock showed a RISE of 4.45M barrels and OPEC said they would consider reducing production when they meet in December.
All the negative news lately made the perfect setting for a good old-fashioned short squeeze today. A short squeeze occurs when the market is extremely bearish in a position and buyers come in and take out the stops from the shorts, thus “squeezing” price higher. This seems to be what happened today. After testing the lows of 50.50 five times since the beginning of June, WTI broke those a descending trending yesterday and closed above it just below horizontal resistance at 54.90.
Source: Tradingview, City Index, NYMEX
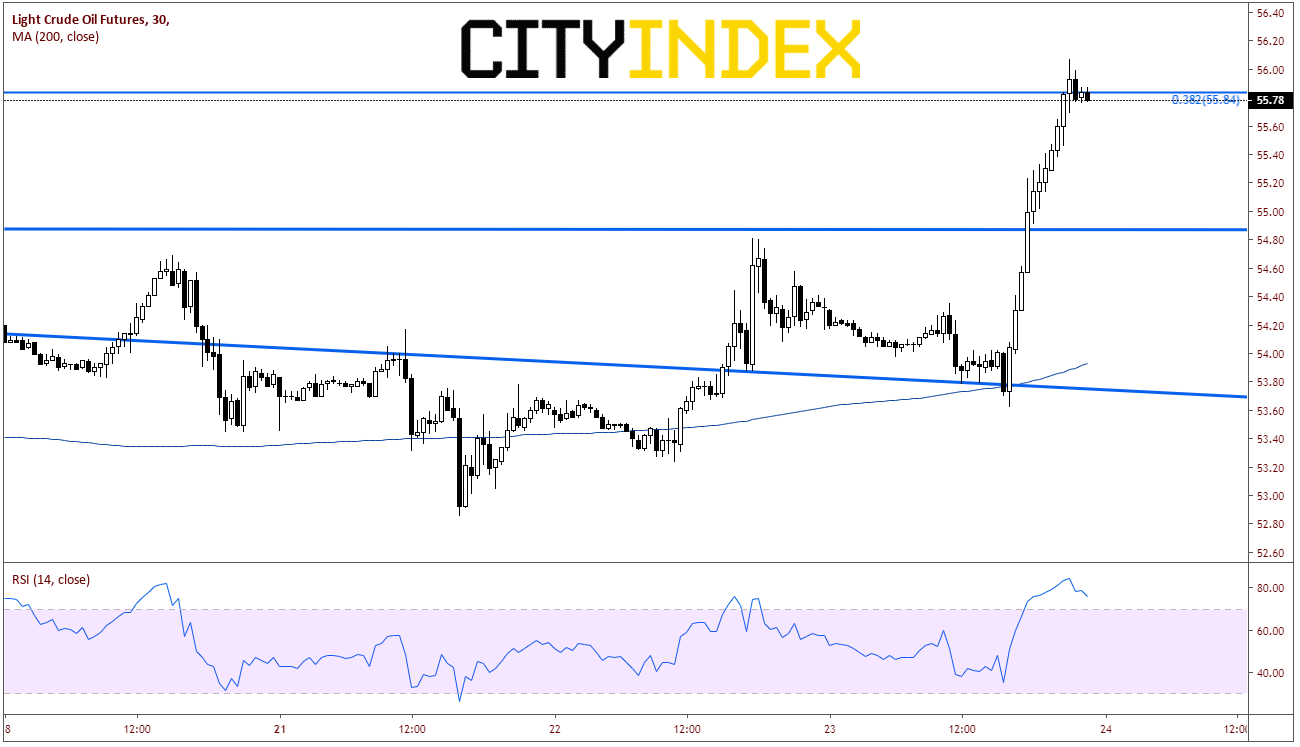
On a 30-minutes chart, we can see that WTI was retesting the broken trendline when the data was released. The market moved swiftly higher and price broke through the 54.90 level. From there is was a $1.00 squeeze higher as shorts got stopped out of the market. Also notice that price halted near the 38.2% Fibonacci retracement level from the highs on September 16th (after the attack on Saudi Aramco) to the lows on October 3rd. (see daily chart) The RSI on the 30-minute chart is in overbought territory as well, implying a short-term pullback may be ahead.
Source: Tradingview, City Index, NYMEX
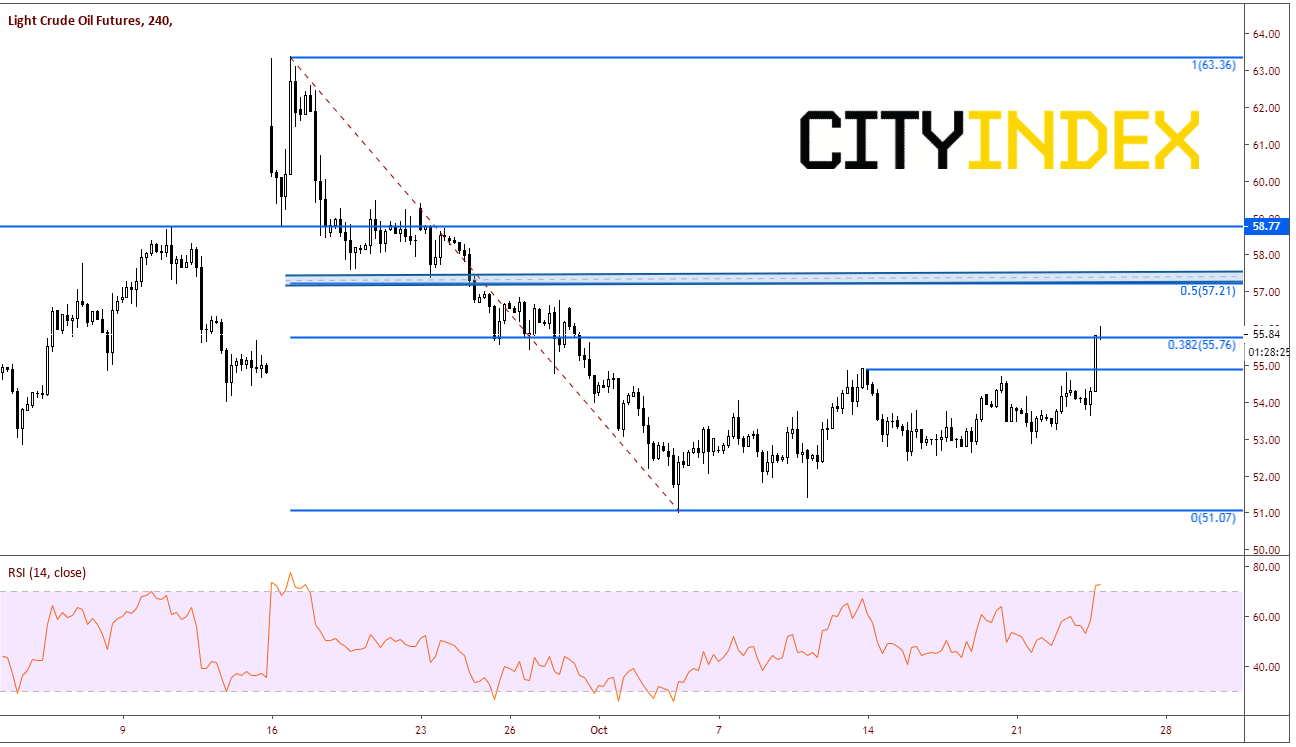
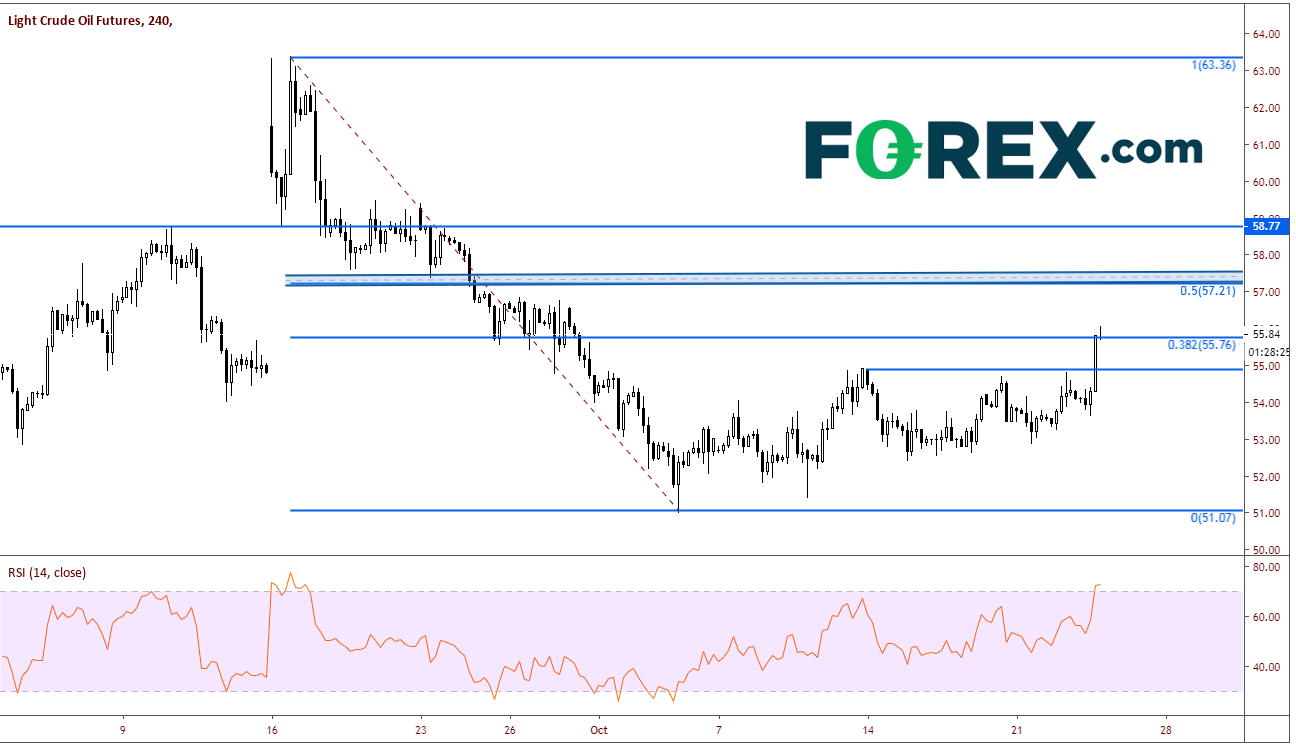
On a 240-minute chart, first resistance is horizontal resistance and the 50% retracement level from the previously mentioned timeframe near 57.25. If price breaks above, next level of horizontal resistance is near 58.75. First support comes in near 55.00. Below that, there isn’t much in the way for price to head back towards 51.00.
West Texas Oil futures were up 2.40% today near $55.82 after the EIA (Energy Information Administration) reported a surprise draw in crude inventories last week. The EIA reported a draw of -1.699M barrels vs a 2.232M expected, and 9.281M the prior week. Crude has been getting battered lately due to fear of the less demand from the global slowdown and the China-US trade war. In addition, yesterday’s API Weekly Crude Oil Stock showed a RISE of 4.45M barrels and OPEC said they would consider reducing production when they meet in December.
All the negative news lately made the perfect setting for a good old-fashioned short squeeze today. A short squeeze occurs when the market is extremely bearish in a position and buyers come in and take out the stops from the shorts, thus “squeezing” price higher. This seems to be what happened today. After testing the lows of 50.50 five times since the beginning of June, WTI broke those a descending trending yesterday and closed above it just below horizontal resistance at 54.90.
Source: Tradingview, FORX.com, NYMEX
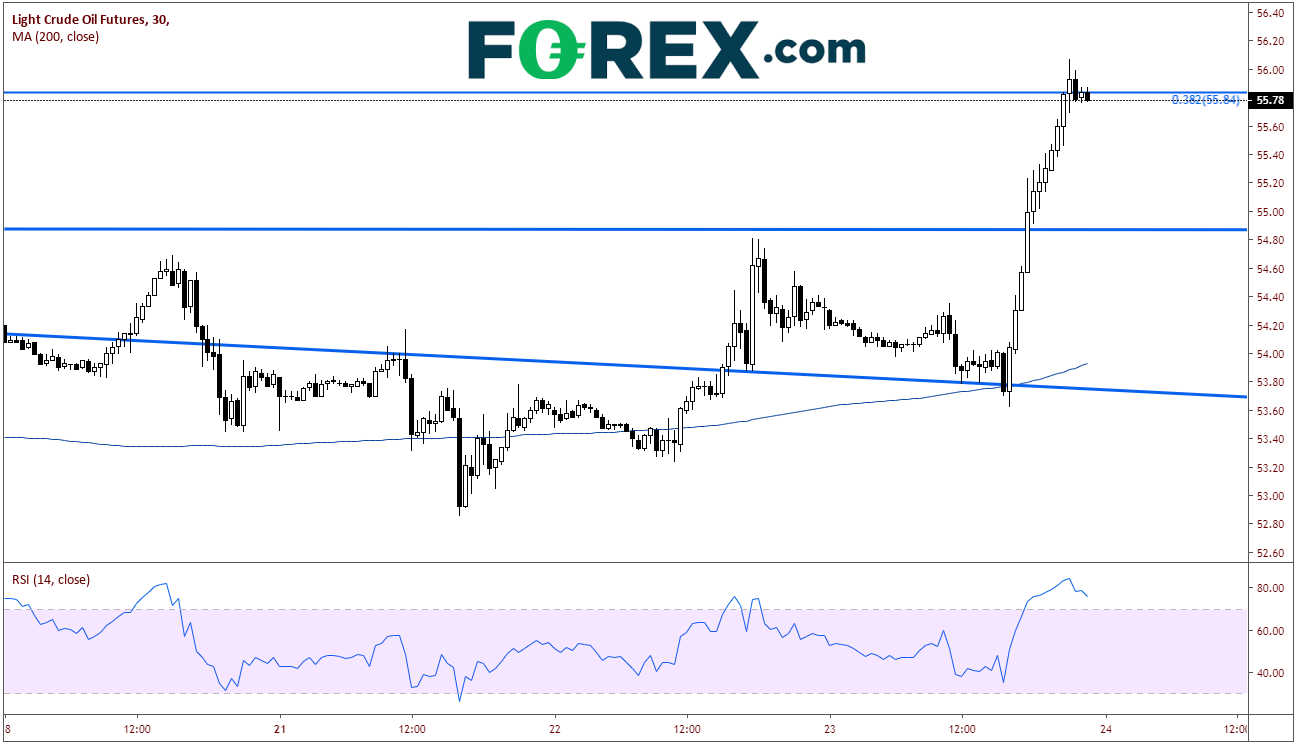
On a 30-minutes chart, we can see that WTI was retesting the broken trendline when the data was released. The market moved swiftly higher and price broke through the 54.90 level. From there is was a $1.00 squeeze higher as shorts got stopped out of the market. Also notice that price halted near the 38.2% Fibonacci retracement level from the highs on September 16th (after the attack on Saudi Aramco) to the lows on October 3rd. (see daily chart) The RSI on the 30-minute chart is in overbought territory as well, implying a short-term pullback may be ahead.
Source: Tradingview, FORX.com, NYMEX
On a 240-minute chart, first resistance is horizontal resistance and the 50% retracement level from the previously mentioned timeframe near 57.25. If price breaks above, next level of horizontal resistance is near 58.75. First support comes in near 55.00. Below that, there isn’t much in the way for price to head back towards 51.00.
Related tags:
Latest market news




Open an account in minutes
Experience award-winning platforms with fast and secure execution.
Economic calendar
Web Trader platform
Our sophisticated web-based platform is packed with features.
Related articles
DXY, GBP/USD, AUD/USD, USD/CAD, USD/JPY, Gold Weekly Technical Outlook 11 16 2026
Sr. Technical Strategist Michael Boutros highlights the levels that matter on the USD Majors, commodities, and equity indices charts this week.
Nasdaq 100 Forecast: NDX falls ahead of Nvidia’s earnings & Anthropic’s debut this week
U.S. stocks are heading for a weaker open amid a challenging macro backdrop and with AI-linked stocks once again under pressure ahead of Nvidia's results later this week. Attention is also turning to Anthropic's highly anticipated IPO.


Crude Oil Weekly Outlook: Geopolitics vs Oversupply Risks
Crude Oil Weekly Outlook: The IEA has flagged the risk of an oil supply surplus since the Iran war began. Yet WTI and Brent have held onto bullish rebounds from key support near 84 and 89, respectively, as geopolitical risks persist.

StoneX Financial Ltd (trading as "FOREX.com") is an execution-only service provider. This material, whether or not it states any opinions, is for general information purposes only and it does not take into account your personal circumstances or objectives. This material has been prepared using the thoughts and opinions of the author and these may change. However, FOREX.com does not plan to provide further updates to any material once published and it is not under any obligation to keep this material up to date.
This material is short term in nature and may only relate to facts and circumstances existing at a specific time or day. Nothing in this material is (or should be considered to be) financial, investment, legal, tax or other advice and no reliance should be placed on it. No opinion given in this material constitutes a recommendation by FOREX.com or the author that any particular investment, security, transaction or investment strategy is suitable for any specific person.
The material has not been prepared in accordance with legal requirements designed to promote the independence of investment research. Although FOREX.com is not specifically prevented from dealing before providing this material, FOREX.com does not seek to take advantage of the material prior to its dissemination. This material is not intended for distribution to, or use by, any person in any country or jurisdiction where such distribution or use would be contrary to local law or regulation. For further details see our full non-independent research disclaimer and quarterly summary.