



Yields are screaming. How does that affect AUD/CAD?
US 10-year yields have a strong negative correlation with AUD/CAD.
Share this:

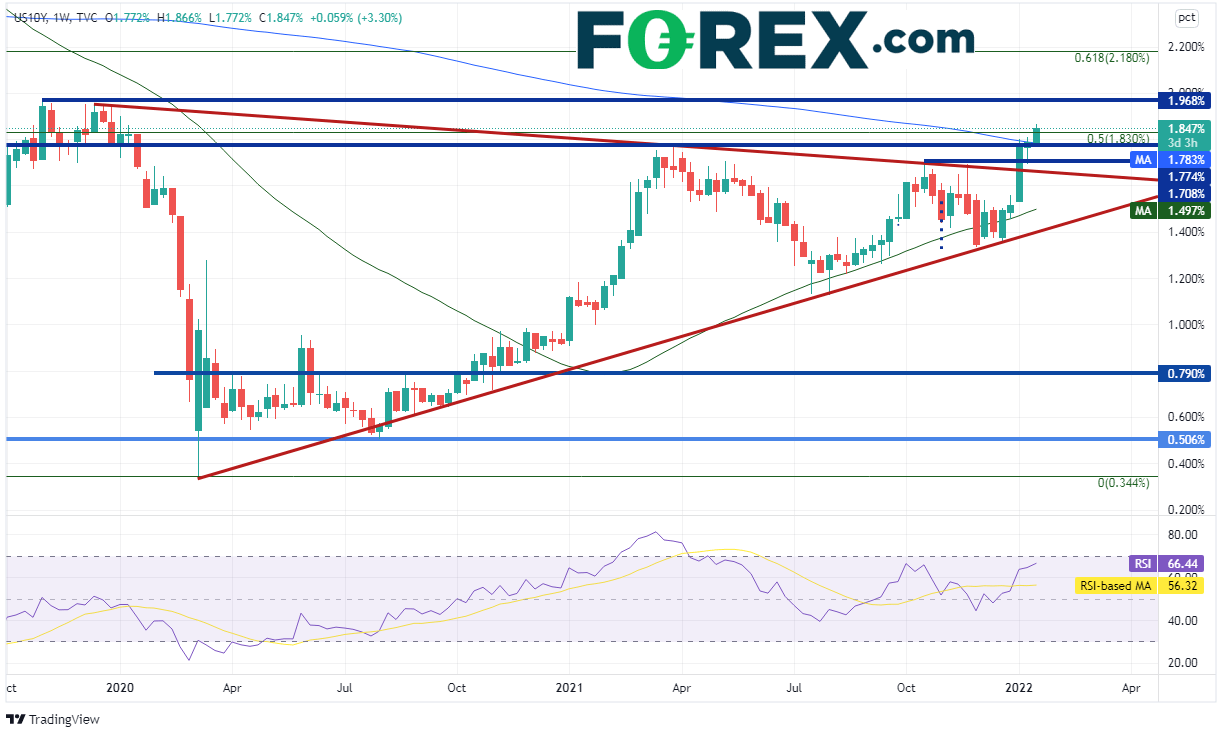
Yields around the world are on the rise. In some places, such as emerging market countries, yields are rising more rapidly than in others. In the US, yields are playing catch up as the 2-year yield crossed 1% for the first time since February 2020, before the coronavirus took over the world. In the 10-year bond, yields reached a high of 1.866% on Tuesday. This is the benchmark’s yields highest level since January 9th, 2020 when it reached a high of 1.9%. However, in doing so, the 10-year yield broke above some key resistance:
- The 2021 high at 1.774%
- The 200 Weekly Moving Average at 1.783%
- The 50% Fibonacci retracement level from the highs of November 2018 to the lows of March 2020, near 1.83%.
On a weekly timeframe, the next level of resistance isn’t until the November 4th, 2019 high at 1.968% and then the big, round number resistance level of 2%. Support is back at the 200 Week Moving Average and the 2021 highs mentioned above.
Source: Tradingview, Stone X
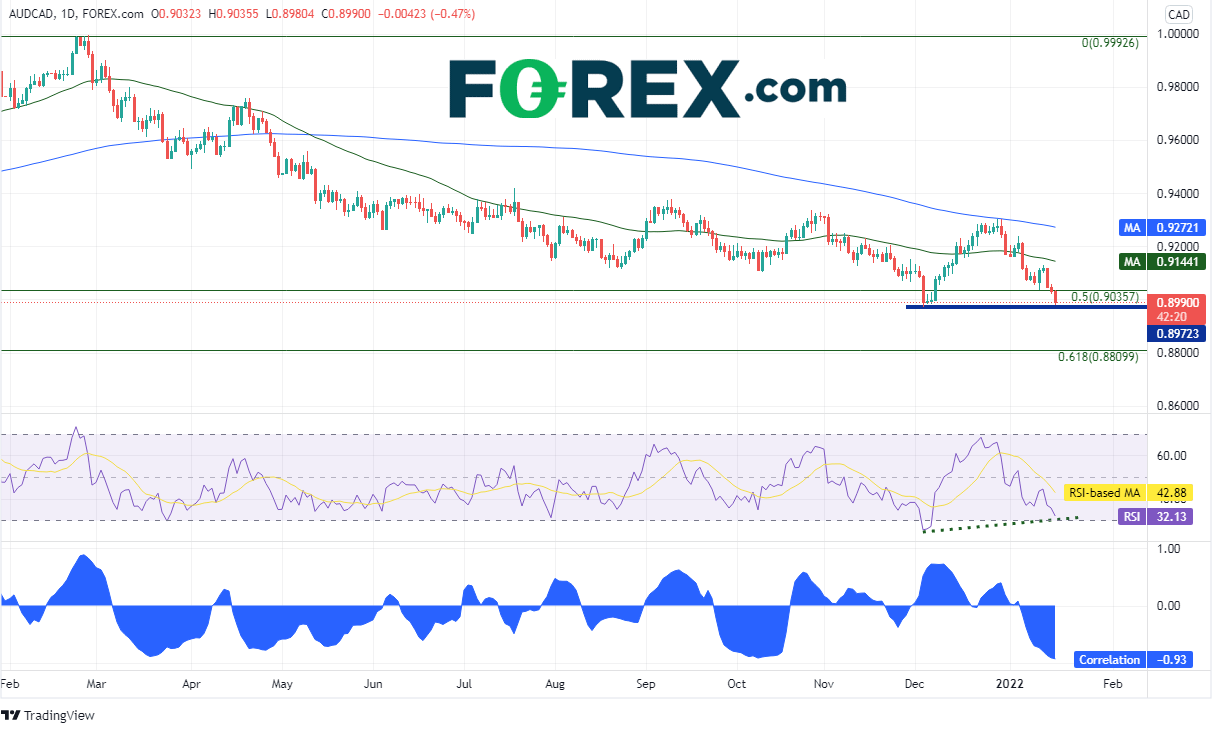
What does that have to do with AUD/CAD? On a daily timeframe, AUD/CAD currently has a strong negative correlation with US 10-year yields. The correlation coefficient is currently -0.93. Any correlation above +0.80 or below -0.80 is considered strong. A reading of -1.00 is a prefect negative correlation, meaning the 2 assets move in opposite directions 100% of the time. A reading of -0.93 is pretty close! Just as US 10-year yields have broken above the 50% retracement from the February 2020 low to the January 2021 high, AUD/CAD has broken below its 50% retracement level from February 2020 high to the February 2021 low. In addition, the pair has now traded within pips of its December 2021 lows. However, notice the RSI is diverging with price, an indication the pair may be ready for a bounce. Will AUD/CAD continue lower?
Source: Tradingview, Stone X
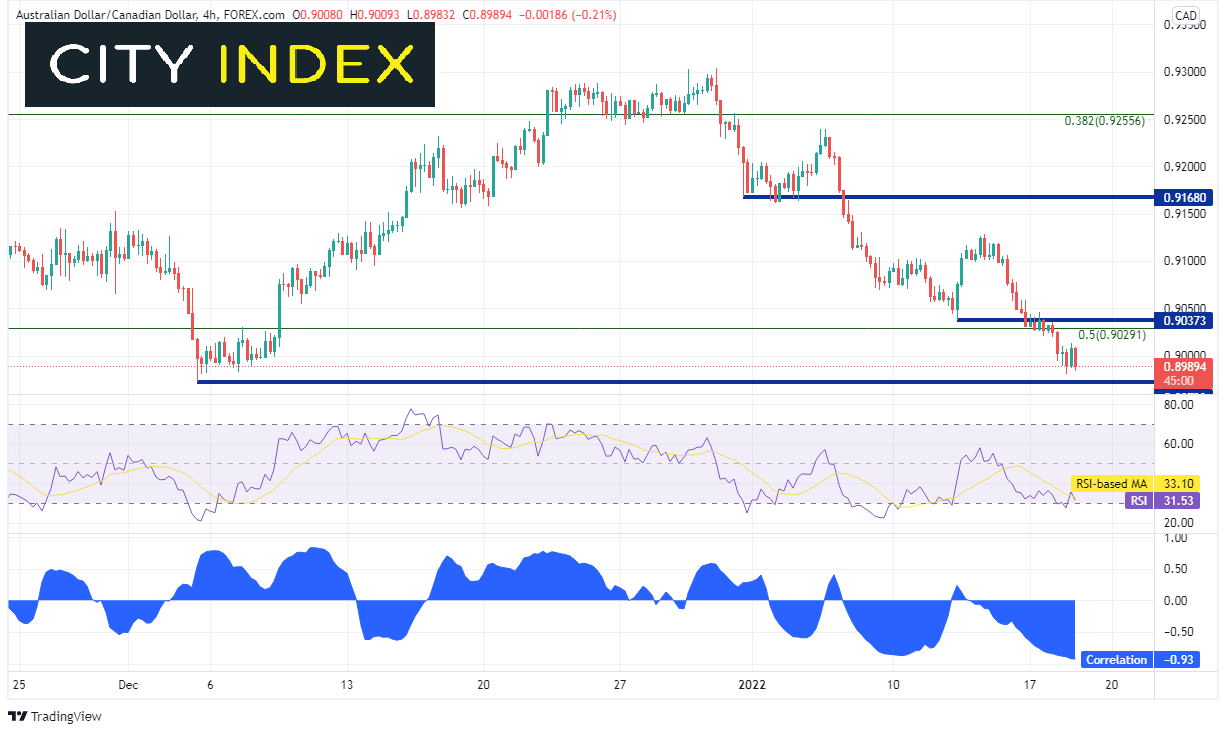
Coincidentally, on a 240-minute timeframe, the correlation coefficient between US 10-year yields and AUD/CAD is also -0.93! Therefore, on the short-term timeframe, the negative correlation is strong as well. This means that If yields continue higher, AUD/CAD should continue lower. A break of the 0.8972 level could usher in stops losses. Support isn’t until the 61.8% Fibonacci retracement level from the previously mentioned timeframe at 0.8810 (see daily). Horizontal resistance above is at 0.9037, 0.9100, and 0.9159. If US 10-yer yields move lower and/or prices bounce with the RSI on the daily, AUD/CAD could pause at any of those levels.

Source: Tradingview, Stone X
US 10-year yields continue to make new highs. These yields have a strong negative correlation with AUD/CAD. Therefore, if yields continue higher, AUD/CAD should continue lower.
Yields around the world are on the rise. In some places, such as emerging market countries, yields are rising more rapidly than in others. In the US, yields are playing catch up as the 2-year yield crossed 1% for the first time since February 2020, before the coronavirus took over the world. In the 10-year bond, yields reached a high of 1.866% on Tuesday. This is the benchmark’s yields highest level since January 9th, 2020 when it reached a high of 1.9%. However, in doing so, the 10-year yield broke above some key resistance:
- The 2021 high at 1.774%
- The 200 Weekly Moving Average at 1.783%
- The 50% Fibonacci retracement level from the highs of November 2018 to the lows of March 2020, near 1.83%.
On a weekly timeframe, the next level of resistance isn’t until the November 4th, 2019 high at 1.968% and then the big, round number resistance level of 2%. Support is back at the 200 Week Moving Average and the 2021 highs mentioned above.

Source: Tradingview, Stone X
What does that have to do with AUD/CAD? On a daily timeframe, AUD/CAD currently has a strong negative correlation with US 10-year yields. The correlation coefficient is currently -0.93. Any correlation above +0.80 or below -0.80 is considered strong. A reading of -1.00 is a prefect negative correlation, meaning the 2 assets move in opposite directions 100% of the time. A reading of -0.93 is pretty close! Just as US 10-year yields have broken above the 50% retracement from the February 2020 low to the January 2021 high, AUD/CAD has broken below its 50% retracement level from February 2020 high to the February 2021 low. In addition, the pair has now traded within pips of its December 2021 lows. However, notice the RSI is diverging with price, an indication the pair may be ready for a bounce. Will AUD/CAD continue lower?

Source: Tradingview, Stone X
Trade AUD/CAD now: Login or Open a new account!
• Open an account in the UK
• Open an account in Australia
• Open an account in Singapore
Coincidentally, on a 240-minute timeframe, the correlation coefficient between US 10-year yields and AUD/CAD is also -0.93! Therefore, on the short-term timeframe, the negative correlation is strong as well. This means that If yields continue higher, AUD/CAD should continue lower. A break of the 0.8972 level could usher in stops losses. Support isn’t until the 61.8% Fibonacci retracement level from the previously mentioned timeframe at 0.8810 (see daily). Horizontal resistance above is at 0.9037, 0.9100, and 0.9159. If US 10-yer yields move lower and/or prices bounce with the RSI on the daily, AUD/CAD could pause at any of those levels.
Source: Tradingview, Stone X
US 10-year yields continue to make new highs. These yields have a strong negative correlation with AUD/CAD. Therefore, if yields continue higher, AUD/CAD should continue lower.
Learn more about forex trading opportunities.
Related tags:
Latest market news




Open an account in minutes
Experience award-winning platforms with fast and secure execution.
Economic calendar
Web Trader platform
Our sophisticated web-based platform is packed with features.
Related articles
DXY, GBP/USD, AUD/USD, USD/CAD, USD/JPY, Gold Weekly Technical Outlook 11 16 2026
Sr. Technical Strategist Michael Boutros highlights the levels that matter on the USD Majors, commodities, and equity indices charts this week.
Gold and silver forecast: Precious metals extend drop but seasonality hopes keeps bullish case alive
It has been a risk off session so far today with stocks, gold and especially silver (-4%) all taking a drop. Gold has fallen to a fresh 2026 low and its now more than $100 below the psychologically important $4,000 mark. A firmer US dollar, rising US rate expectations and fading safe-haven demand have combined to undermine the metal, despite continued central bank buying. This year has so far been a bad one for gold.

EUR/USD forecast: Dollar strength puts 1.1000 support in the spotlight | Currency Pair of the Week
The dollar extended its recent advance at the start of the week, with weakness across risk-sensitive assets reinforcing demand for the US currency. US equity futures slipped ahead of Nvidia’s earnings on Tuesday and an expected stock market debut by Anthropic later this week. Both events represent important tests for an AI trade that has become increasingly vulnerable to shifts in sentiment. In FX, EUR/USD nearly tested the psychologically important 1.1000 level, before bouncing modestly off its lows.
StoneX Financial Ltd (trading as "FOREX.com") is an execution-only service provider. This material, whether or not it states any opinions, is for general information purposes only and it does not take into account your personal circumstances or objectives. This material has been prepared using the thoughts and opinions of the author and these may change. However, FOREX.com does not plan to provide further updates to any material once published and it is not under any obligation to keep this material up to date.
This material is short term in nature and may only relate to facts and circumstances existing at a specific time or day. Nothing in this material is (or should be considered to be) financial, investment, legal, tax or other advice and no reliance should be placed on it. No opinion given in this material constitutes a recommendation by FOREX.com or the author that any particular investment, security, transaction or investment strategy is suitable for any specific person.
The material has not been prepared in accordance with legal requirements designed to promote the independence of investment research. Although FOREX.com is not specifically prevented from dealing before providing this material, FOREX.com does not seek to take advantage of the material prior to its dissemination. This material is not intended for distribution to, or use by, any person in any country or jurisdiction where such distribution or use would be contrary to local law or regulation. For further details see our full non-independent research disclaimer and quarterly summary.