



Are you using the RSI correctly?
The Relative Strength Index (RSI) is a very popular indicator developed by a technical analyst named J. Welles Wilder that helps traders assess the strength of the current market. Find out how to use it.
Share this:

The Relative Strength Index (RSI) is a very popular indicator developed by a technical analyst named J. Welles Wilder that helps traders assess the strength of the current market.
The RSI is similar to the Stochastic in that it identifies overbought and oversold conditions in the market.
It is scaled from 0 to 100.
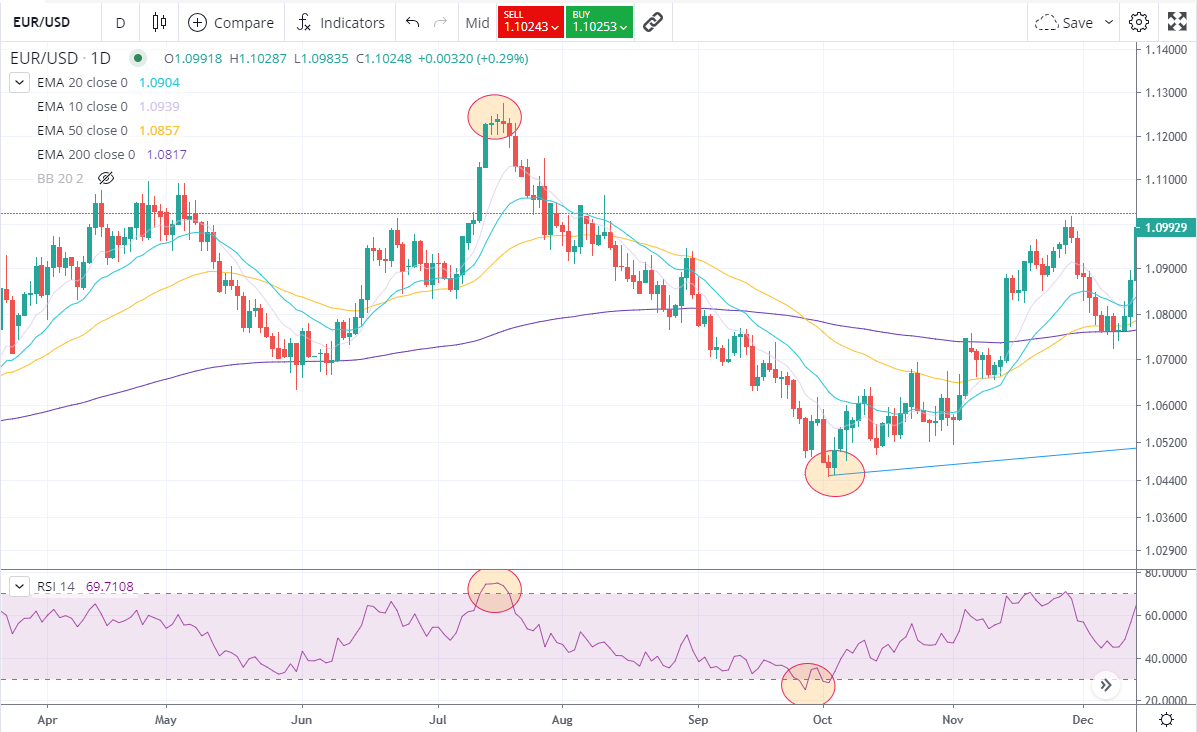
Typically, values of 30 or less indicate oversold market conditions and a higher probability of a price increase.
Some traders interpret an oversold currency pair as an indication that the downward trend is likely to reverse, which represents a buying opportunity.
Values of 70 or more indicate overbought conditions and an increased likelihood of a price decline (downwards).
Some traders interpret an overbought currency pair as a sign that the upward trend is likely to reverse, which is an opportunity to sell.
In addition to the overbought and oversold indicators mentioned above, traders using the Relative Strength Index (RSI) also look for midline crossings.
A move from below the midline (50) to above signals an upward trend.
A rising crossover of the centre line occurs when the RSI value crosses above the 50 line on the scale and moves towards the 70 line. This indicates that the market trend is gaining strength and is considered a bullish signal until the RSI approaches the 70 line.
A move from above the centre line (50) downwards indicates a falling trend.
A falling centre line occurs when the RSI value falls BELOW the 50 line on the scale and moves towards the 30 line. This indicates that the market trend is losing strength and is considered a bearish signal until the RSI approaches the 30 line.
How to trade with the RSI
The RSI can be used just like the stochastic indicator.
We can use it to identify potential highs and lows depending on whether the market is overbought or oversold.
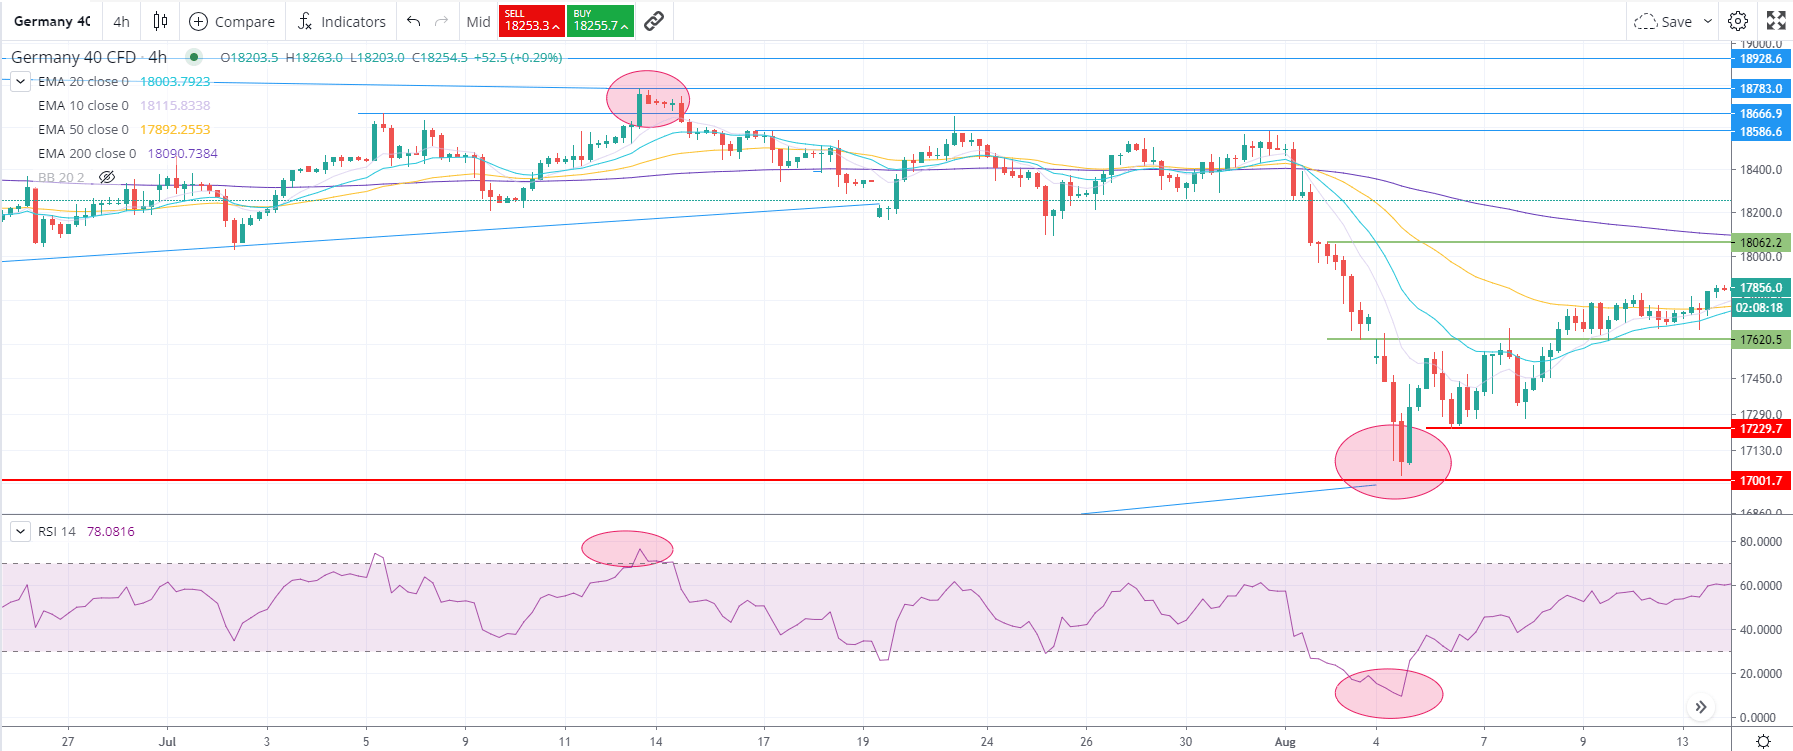
Below is a 4-hour chart of the DAX. The red bubbles on the right of the chart show the areas where the RSI was overbought while the price was at an all-time high. Then there was a consolidation for 3 weeks. And then after a big drop, the RSI reached the oversold areas where the price also bounced, marking the bottom of what is visible on the chart.
The DAX was in a downtrend for the whole week and fell about 1,500 points over the course of two weeks.
You can see that the red bubble above the RSI marks the overbought state and the bubble below the RSI marks the oversold state.
After 12 July, the price retreated and failed to reach the previous high at an overbought level, and after a brief consolidation, it fell again. The RSI fell below the 30 line on 1 August, indicating that the level was already oversold and the movement could be over. However, the price continued to fall and only after the downward spike on 5 August did the price recover and rise above the 30 line and the 50 line.
In the weeks that followed, the price then moved upwards without crossing the 70 line or falling below the 30 line.
Determining the trend with the RSI
The RSI is a very popular tool because it can also be used to confirm trend formations.
If you think a trend is forming, take a quick look at the RSI and check if it is above or below the 50 mark.
If you see a possible uptrend, make sure the RSI is above 50.
If it is a potential DOWNTREND, the RSI should be below the 50 mark.
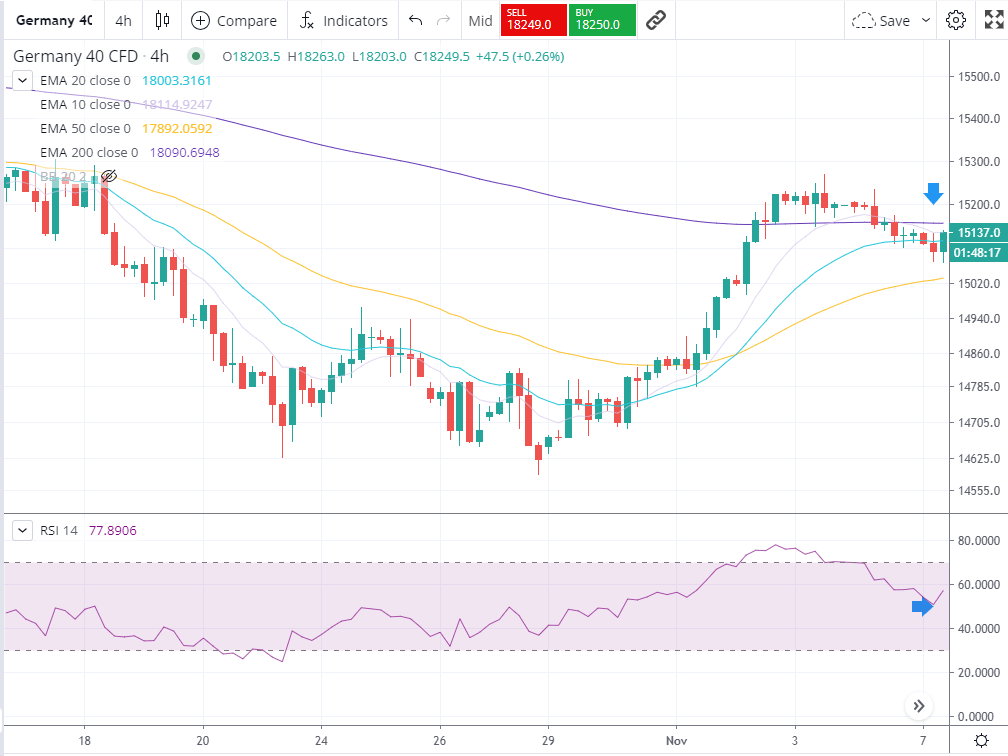
At the beginning of the above chart, the trend was up and above the 70 mark of the RSI before dropping towards the 50 midline, as marked on the chart with the blue lower arrow. However, the last green candle showed a sharp spike in the RSI, which could indicate that the trend could continue as the price is still above the 50 midline. Since the 50 EMA is below the price, it could be seen as another line of support for the price.
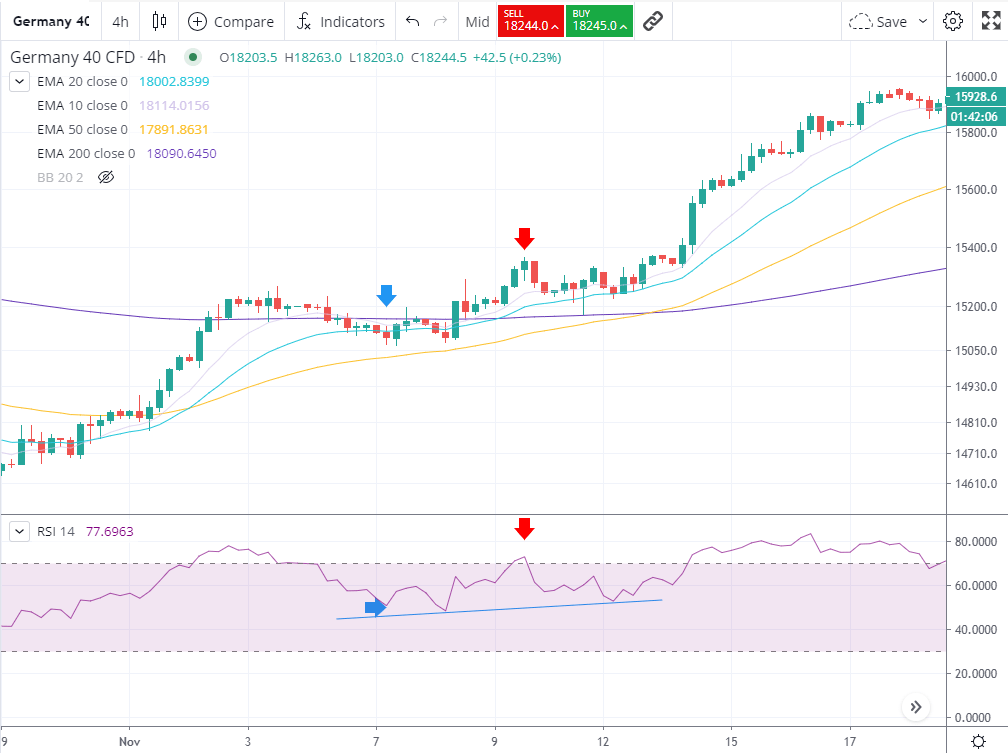
As we see on the chart 3 weeks later. The RSI continued to be above the 50 RSI midline and the price continued to move upwards. The first interesting aspect is that the RSI has once again entered the overbought region, as indicated by the red arrow. However, even after that, the RSI did not fall below 50, but remained above the 50 midline as the price continued to rise.
To avoid making a mistake, we could wait for the RSI to fall below 50 or for a return to confirm our trend.
If the RSI falls below 50, it could confirm that a downward trend has formed. Since the RSI is showing decreasing strength
Related tags:
Latest market news




The complete CFD trading experience
Award-winning platforms, competitive spreads, low commissions and dedicated support.
We live and breathe the markets and are dedicated to helping traders realise their ambitions as we continue to set the industry bar.
Economic calendar
Web Trader platform
Our sophisticated web-based platform is packed with features.
Related articles
Crude Oil Weekly Outlook: Brent Tests September Highs, WTI Tops $100, and XLE Reclaims 18-Year Resistance
Crude Oil Weekly Outlook: Brent is testing its September highs, WTI has moved towards $100, and XLE has reclaimed its 18 year resistance. Explore the key levels that could define the next move in oil.
Euro Technical Forecast: EUR/USD Snaps Five-Week Slide at Critical Support 10 17 2026
Euro is attempting to regain its footing as stretched momentum raises the stakes for the next move ahead of key PMI data and central bank decisions.


USD/JPY Weekly Outlook: Volatility Has Left the Building
The yen has ignored broad dollar weakness, falling Treasury yields and renewed market turbulence. Yet its relationship with US interest rates remains intact. So why is USD/JPY going absolutely nowhere fast?

StoneX Europe Ltd may make third party material available on this website which may contain information included but not limited to the conditions of financial markets. The material is for information purposes only and does not contain, and should not be construed as containing, investment advice and/or investment recommendation and/or an investment research and/or an offer of or solicitation for any transactions in financial instruments; any decision to enter into a specific transaction shall be made by the client following an assessment by him/her of their situation.
StoneX Europe Ltd makes no representation or warranty and assumes no liability as to the accuracy or completeness of the information provided, nor any loss arising from any investment based on a recommendation, forecast or other information supplied. You should always seek independent advice as to your suitability to speculate in any related markets and your ability to assume the associated risks, if you are at all unsure. We are not under any obligation to update any such material. Any opinion made may be personal to the author and may not reflect the opinion of StoneX Europe Ltd.