




Asian Open Strong ISM Services Although ADP Raises a Red Flag
ADP employment data completely missed expectations ahead of Friday’s NFP report, although the blow was softened by a robust services PMI.
Share this:

Asian Indices:
- Australia's ASX 200 index rose by 57.3 points (0.82%) and currently trades at 7,006.10
- Japan's Nikkei 225 index has risen by 194.89 points (0.6%) and currently trades at 32,777.88
- Hong Kong's Hang Seng index has fallen by -16.84 points (-0.1%) and currently trades at 17,409.37
- China's A50 Index has fallen by -11.21 points (-0.09%) and currently trades at 11,970.42
UK and European indices:
- UK's FTSE 100 futures are currently down -4 points (-0.05%), the cash market is currently estimated to open at 7,421.83
- Euro STOXX 50 futures are currently up 6 points (0.14%), the cash market is currently estimated to open at 4,238.19
- Germany's DAX futures are currently up 22 points (0.14%), the cash market is currently estimated to open at 15,367.00
US index futures:
- DJI futures are currently up 4 points (0.01%)
- S&P 500 futures are currently up 3.25 points (0.07%)
- Nasdaq 100 futures are currently up 27 points (0.17%)
Once again, the 1-day implied volatility levels for EUR/USD and USD/JPY have blown out ahead of a busy calendar. Central bank members from the Fed, ECB, BOE and SNB will hit the wires, European GDP is also on tap ahead of the key US inflation report.
US inflation is likely to be a binary event; it either comes in hotter than expected to justify hawkish comments from the Fed and weigh on risk whilst supporting the US dollar, or it comes in soft and we see the reverse. Unless of course data comes in roughly on target and we’re none the wiser as to whether market pricing or Fed comments are closer to the truth.
Volatility has been typically low ahead of such an event, but we doubt it will remain that way by the close.
Events in focus (GMT):
- 07:00 – UK earnings, employment data
- 07:45 – SNB chairman Jordan speaks
- 08:00 – Spanish CPI, ECB Lane speaks,
- 08:45 – ECB’s Enria speaks
- 09:00 – IEA monthly report
- 10:00 – Eurozone GDP, employment, ZEW economic sentiment, German ZEW economic sentiment
- 10:30 – Fed Jefferson speaks
- 13:30 – US inflation
- 13:45 – BOE member Pill speaks
- 15:00 – Fed vice chair Barr speaks
- 17:45 – Fed Goolsbee speaks
EUR/USD technical analysis (4-hour chart):
EUR/USD has been within a consolidation over the past six days, after its strong rally above the 1.07 handle was foiled by the 200-day EMA. I noted in the weekly COT report that futures traders have continued to trim their short exposure in recent weeks which has allowed EUR/USD to rise, despite weak economic data coming out of Europe. And that means there may be more upside potential over the near-term, especially if US inflation data comes in softer than expected.
The 4-hour chart shows that the current consolidation has filled the liquidity gap between 1.6680 – 1.0690 that was left during its strong rally to 1.07. Interestingly, heavy trading activity has taken place around the consolidation lows, with a series of lower wicks also suggesting there’s demand around 1.0670.
The bias is for prices to eventually move higher. But I would not be surprised to see EUR/USD try and at least test the lows before momentum realigns with its intended direction (higher). Therefore, unless we see a particularly strong set of CPI data from the US, I would prefer to seek bullish setups around support levels in anticipation of a break back above 1.0700.
USD /JPY technical analysis (1-hour chart):
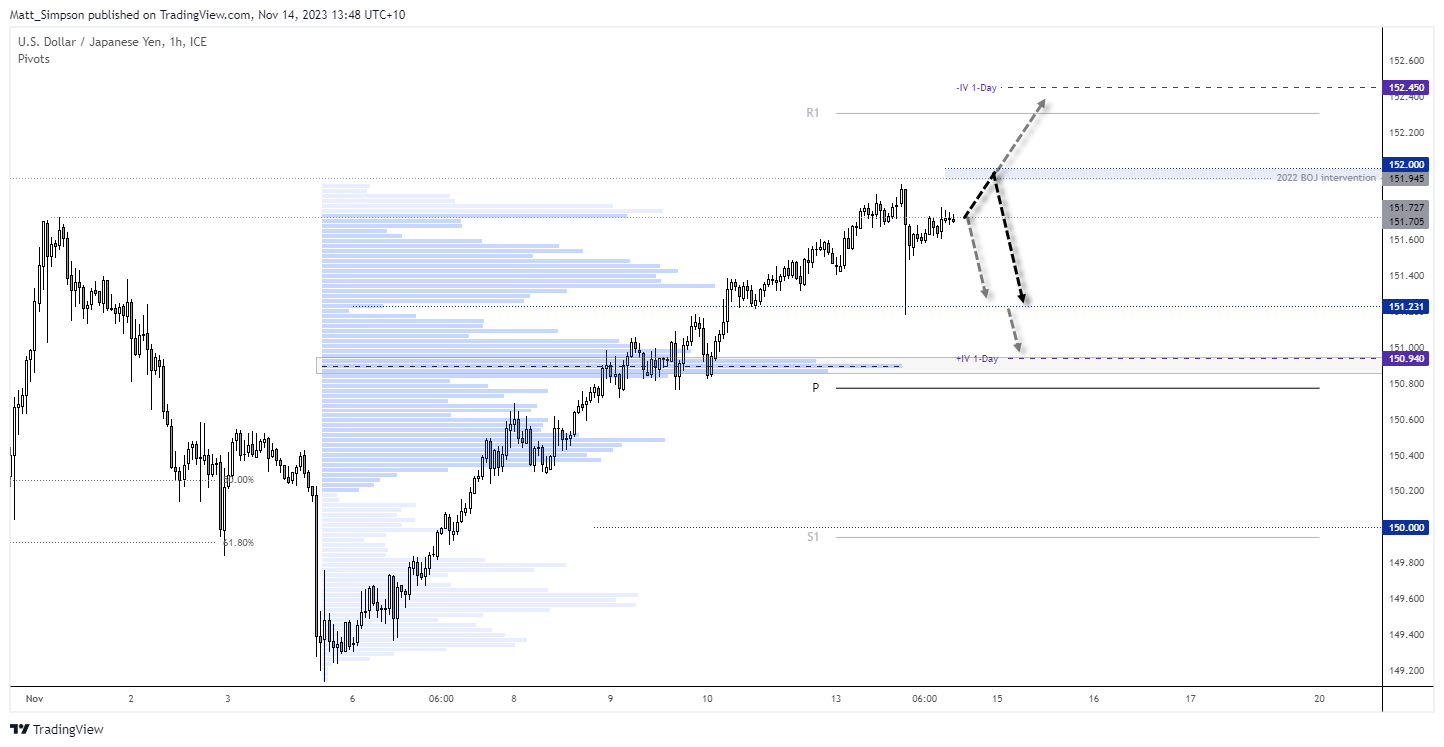
USD/JPY may have reached a 13-month high on Monday, yet its 70-pip drop suggests options traders do not want to see this higher for now. And if it does rise leading into US CPI, I wouldn’t be surprised if we saw USD/JPY selloff again around the 2022 BOJ intervention / 152 handle.
Take note that the 1-day implied volatility level is around 220% of its 20-day EMA ahead of today’s inflation report, so volatility is clearly expected.
A refreshingly soft CPI print could send USD/JPY sharply lower, although I’d expected a decent support around the 151 handle due to the high-volume node form the prior rally and the monthly pivot point just below.
View the full economic calendar
View the full economic calendar
-- Written by Matt Simpson
Follow Matt on Twitter @cLeverEdge
How to trade with City Index
You can trade with City Index by following these four easy steps:
- Open an account, or log in if you’re already a customer
• Open an account in the UK
• Open an account in Australia
• Open an account in Singapore
- Search for the market you want to trade in our award-winning platform
- Choose your position and size, and your stop and limit levels
- Place the trade
Related tags:
Latest market news




The complete CFD trading experience
Award-winning platforms, competitive spreads, low commissions and dedicated support.
We live and breathe the markets and are dedicated to helping traders realise their ambitions as we continue to set the industry bar.
Economic calendar
Web Trader platform
Our sophisticated web-based platform is packed with features.
Related articles
USD/JPY Q4 2026 Outlook: Hawkish Fed Pricing Clashes With Intervention Risk
The year-end tug-of-war is clear: hawkish Fed pricing supports USD/JPY, while intervention risk limits the upside.
USD/CAD and USD/MXN Q4 2026 Outlook: Will the U.S. Dollar Dominate North America Again?
The final stretch of 2026 is approaching, and North America's major currencies have begun to show a shift in the strength dynamics seen earlier in the year. New expectations of a more aggressive monetary policy stance, particularly in the United States, could be significantly reshaping the outlook for the region. At the same time, this backdrop, combined with potential trade tensions across North America, may become one of the most important drivers of currency performance in the months ahead.

Japanese Yen Forecast: USD/JPY 4% Rally Challenges Post-Intervention Downtrend 9 24 2026
USD/JPY momentum has shifted sharply higher, putting a major resistance confluence in focus as U.S. and Japanese event risk builds.

StoneX Europe Ltd may make third party material available on this website which may contain information included but not limited to the conditions of financial markets. The material is for information purposes only and does not contain, and should not be construed as containing, investment advice and/or investment recommendation and/or an investment research and/or an offer of or solicitation for any transactions in financial instruments; any decision to enter into a specific transaction shall be made by the client following an assessment by him/her of their situation.
StoneX Europe Ltd makes no representation or warranty and assumes no liability as to the accuracy or completeness of the information provided, nor any loss arising from any investment based on a recommendation, forecast or other information supplied. You should always seek independent advice as to your suitability to speculate in any related markets and your ability to assume the associated risks, if you are at all unsure. We are not under any obligation to update any such material. Any opinion made may be personal to the author and may not reflect the opinion of StoneX Europe Ltd.