



ASX 200 Market Outlook: Coles (COL) Eyes Rally from 200-Day MA
The ASX 200 hints at a swing low as December seasonality improves, with Coles flashing bullish signals from 200-day MA support.
Share this:

The ASX 200 may be attempting to carve out a short-term base just as December seasonality begins to turn more supportive. While the index has lagged Wall Street and Europe in recent weeks, technical signals suggest downside momentum may be easing.
SPI 200 futures tracked Wall Street higher overnight, raising the prospect of a late-year Santa rally for Australian equities. Within the index, Coles stands out as a potential upside candidate after rebounding from key long-term support.
View related analysis:
View related analysis:
ASX 200 Outlook: Seasonality Turns Supportive as Coles Finds Support
ASX 200 Market Snapshot
- The ASX 200 cash index hinted at a potential swing low on Thursday, forming a high-volume, narrow-range bullish pin bar after Wednesday’s bullish hammer.
- SPI 200 futures tracked Wall Street higher overnight, potentially setting the stage for a Santa rally to begin today or early next week in the Australian share market.
- Nine of the 11 ASX 200 sectors remain lower month-to-date, led by Industrials (XNJ) and Information Technology (XIJ), while Materials (XMJ) and Financials (XFJ) are the two sector leaders.
- While the ASX 200 has underperformed Wall Street and the DAX recently, December seasonality tends to favour stronger bullish returns, supported by the historical Santa rally pattern.
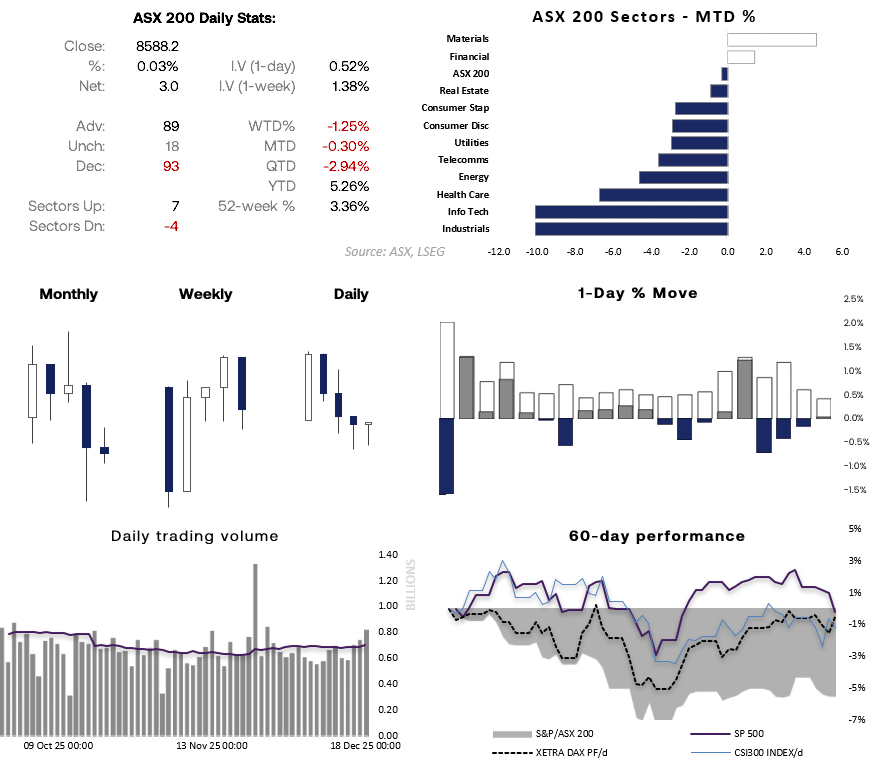
Chart analysis by Matt Simpson - source: ASX, LSEG


ASX 200 Seasonality for December
While this has been mentioned previously, it is worth restating for those unfamiliar. The ASX 200 has a strong seasonal bias toward gains in December, particularly from around 17 December onward.
Over the past 25 years, the ASX 200 has posted a positive December close 64% of the time, with an average return of 1.4% and a median gain of 2%. The bulk of these gains tend to occur in the second half of the month, with both average returns and win rates improving notably between 17 and 29 December. New Year’s Eve, by contrast, has delivered negative returns around 75% of the time.
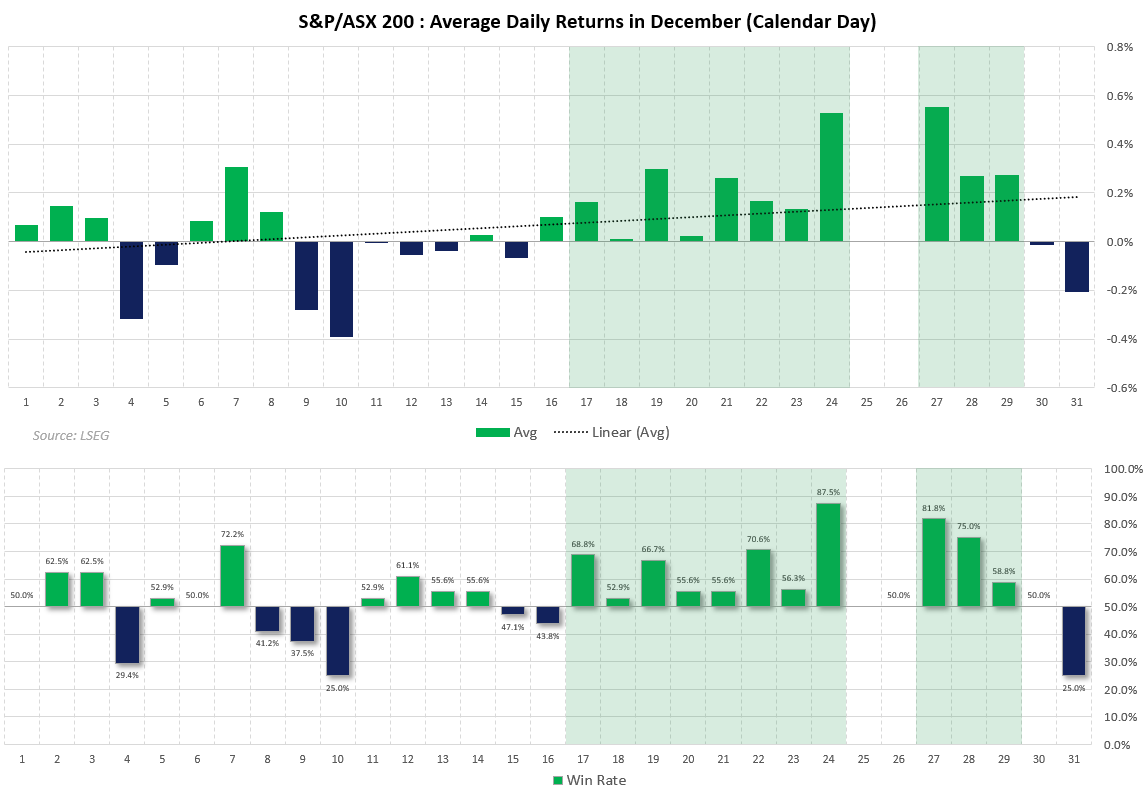
Chart analysis by Matt Simpson - Source: TradingView, ASX SPI 200 Index Futures


Coles (COL) Outlook: Bullish Signals from 200-Day MA
For several weeks I have favoured Woolworths (WOW) over rival Coles (COL) for the bull camp, but with WOW’s rally stalling below its 200-day SMA, it may be time for a rethink — particularly as COL is now flashing bullish signals above its own 200-day SMA.
The weekly chart shows COL on track to form a small bullish candle at the August high near 21.40. An established uptrend remains intact, while a bullish RSI (2) divergence has formed in oversold territory.
On the daily chart, COL bounced from the 200-day SMA on Wednesday and the 200-day EMA on Thursday, with volumes rising and running above average.
My bias remains bullish above the double-bottom low near 21.38, with a break above 22 now anticipated. Bulls can keep an open upside target — and hope Santa delivers a late-year rally.
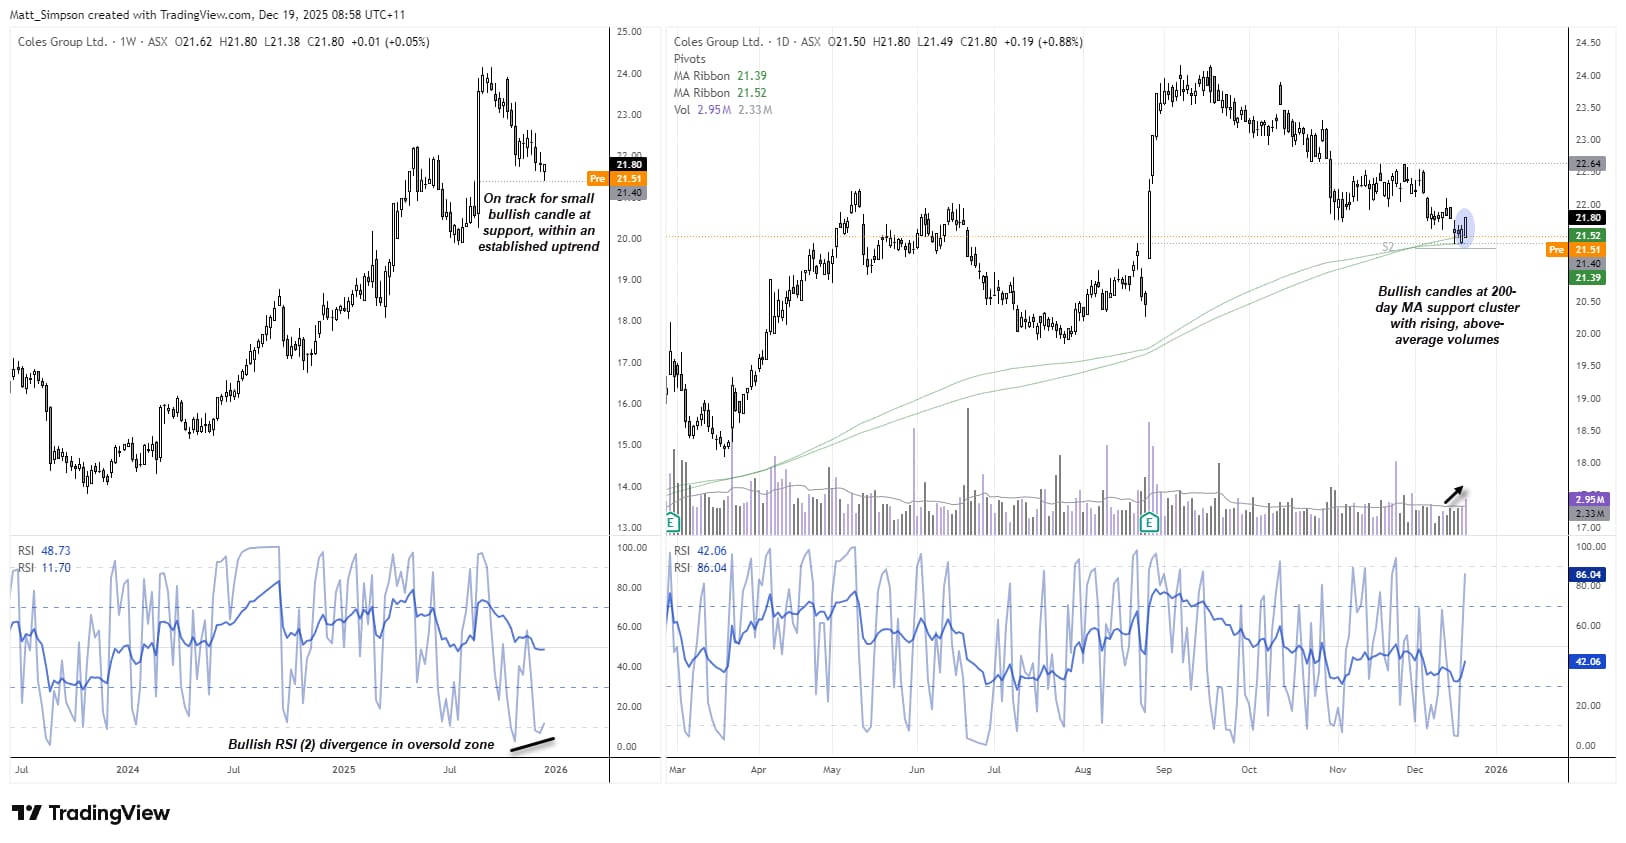
Chart analysis by Matt Simpson - source: ASX, LSEG
View the full economic calendar
View the full economic calendar
-- Written by Matt Simpson
Follow Matt on Twitter @cLeverEdge
How to trade with City Index
You can trade with City Index by following these four easy steps:
- Open an account, or log in if you’re already a customer
• Open an account in the UK
• Open an account in Australia
• Open an account in Singapore
- Search for the market you want to trade in our award-winning platform
- Choose your position and size, and your stop and limit levels
- Place the trade
Related tags:
Latest market news




The complete CFD trading experience
Award-winning platforms, competitive spreads, low commissions and dedicated support.
We live and breathe the markets and are dedicated to helping traders realise their ambitions as we continue to set the industry bar.
Economic calendar
Web Trader platform
Our sophisticated web-based platform is packed with features.
Related articles
Magnificent Seven Earnings Preview: Is the AI Boom Facing Its Biggest Test Yet?
After a wobble in the broader AI trade, the Magnificent Seven" stocks are reporting earnings in the coming week - see the key themes and Nasdaq 100 levels to watch!

Nasdaq 100 forecast: Tech stocks not out of woods yet
US index futures pushed higher in the first half of Friday’s session, taking cues from a strong performance from European equities. Both European and US equity futures extending yesterday’s impressive recovery after the sharp sell-off earlier in the week. But the lingering concerns around the AI investment cycle remain, while bond markets were easing lower again, lifting yields.


ASX 200 Outlook: A Rates Trade Disguised as a Stock Market?
Australian bond futures have exhibited a far stronger relationship with the ASX 200 than Wall Street over recent months. Now both markets are displaying remarkably similar price structures.

StoneX Europe Ltd may make third party material available on this website which may contain information included but not limited to the conditions of financial markets. The material is for information purposes only and does not contain, and should not be construed as containing, investment advice and/or investment recommendation and/or an investment research and/or an offer of or solicitation for any transactions in financial instruments; any decision to enter into a specific transaction shall be made by the client following an assessment by him/her of their situation.
StoneX Europe Ltd makes no representation or warranty and assumes no liability as to the accuracy or completeness of the information provided, nor any loss arising from any investment based on a recommendation, forecast or other information supplied. You should always seek independent advice as to your suitability to speculate in any related markets and your ability to assume the associated risks, if you are at all unsure. We are not under any obligation to update any such material. Any opinion made may be personal to the author and may not reflect the opinion of StoneX Europe Ltd.