



Nasdaq 100 Outlook: Broadcom Extends Slide, Palantir Reversal Signal
Nasdaq 100 slides as AI funding fears bite, with Broadcom extending losses and Palantir flashing a potential reversal at resistance.
Share this:
The Nasdaq 100 has turned lower at a critical juncture, with renewed concerns over AI funding pressuring heavyweight tech stocks. Broadcom’s post-earnings slide and emerging reversal signals in Palantir suggest downside risks are building for the index, raising questions over whether this year’s seasonal Santa rally will materialise at all.
View related analysis:
- S&P 500 Seasonality: How Santa's Rally Across Wall Street Stacks Up
- Nasdaq 100 Grinds Higher, AMZN, AMD, TSLA Show Reversal Risks
- USD/JPY Wrongfoots Bears Ahead of BoJ, Nikkei Looks in Trouble
- Nasdaq 100 Leads Wall Street, Meta Bounce Gains Traction
- Nasdaq 100 Lags Dow Jones: Divergent Signals Among Nvidia, Apple, Meta
View related analysis:
- S&P 500 Seasonality: How Santa's Rally Across Wall Street Stacks Up
- Nasdaq 100 Grinds Higher, AMZN, AMD, TSLA Show Reversal Risks
- USD/JPY Wrongfoots Bears Ahead of BoJ, Nikkei Looks in Trouble
- Nasdaq 100 Leads Wall Street, Meta Bounce Gains Traction
- Nasdaq 100 Lags Dow Jones: Divergent Signals Among Nvidia, Apple, Meta
Nasdaq 100 Technical Outlook: Wave C Risks Build
The Nasdaq 100 led Wall Street lower on Wednesday as concerns over AI funding continued to weigh on the tech sector. The index is now on track for a second bearish week after forming a bearish hammer near record highs in November — a warning signal that upside momentum was stalling.
A bearish engulfing candle formed last week to suggest the end of wave B has been seen, and that the recent selloff is the earlier stages of a wave C of a simple ABC correction. Assuming wave equality (where the length of wave C equals wave A), the Nasdaq could be headed down towards 26,300, just above the 2024 high of 23,364.
Also note that the two heaviest volume bars on the weekly chart are both bearish bars, the most recent being last week’s bearish engulfing week. And that Wednesday’s bearish engulfing day respected the 50-day SMA as resistance, was also on high volume, and precede by a bearish divergence on the daily RSI (2).

Chart analysis by Matt Simpson, Source: NYSE, TradingView
Nasdaq 100 Market Snapshot: Volatility and AI Drag
- The -1.9% decline was its worst daily fall in 18 sessions and the most volatile in 16
- This strengthens the case for an ongoing ABC corrective move, with price action now consistent with a wave C decline
- Over the past three months, Thursday has averaged a 400-point daily range, rising to 409 points on Fridays
- Oracle (ORCL) fell 5.4% to a six-month low after reports that Blue Owl, its largest data-centre partner, will not back a US$10bn deal for a new facility
- Nvidia (NVDA) slid 2.3% to a three-week low, aligning with the bearish bias flagged in late November; it currently shows a strong 20-day correlation of 0.94 with the Nasdaq 100
- Broadcom (AVGO) dropped 4.4%, taking weekly losses to 9.4%, and now shares an almost perfect 20-day correlation of 0.97 with the Nasdaq 100

Chart analysis by Matt Simpson - data source: NYSE, TradingView


Broadcom (AVGO) Share Price Weakness Weighs on Nasdaq
Last week’s earnings beat failed to impress investors, with Broadcom (AVGO) now down over 20% from its record high — pushing it into bear market territory. The sell-off has been marked by large bearish candles on heavy volume, often close to twice the 20-day average, signalling aggressive distribution rather than routine profit-taking.
AVGO printed a bearish engulfing candle on Wednesday, driving prices down to the October low. Given its strong correlation with the Nasdaq 100, this price action raises broader concerns for the tech sector and casts doubt over the likelihood of a traditional Santa rally this year.
While a short-term bounce from current levels remains possible, the risk is that bears fade any recovery. A break below 300 would bring the 200-day moving average near 280 firmly into focus.
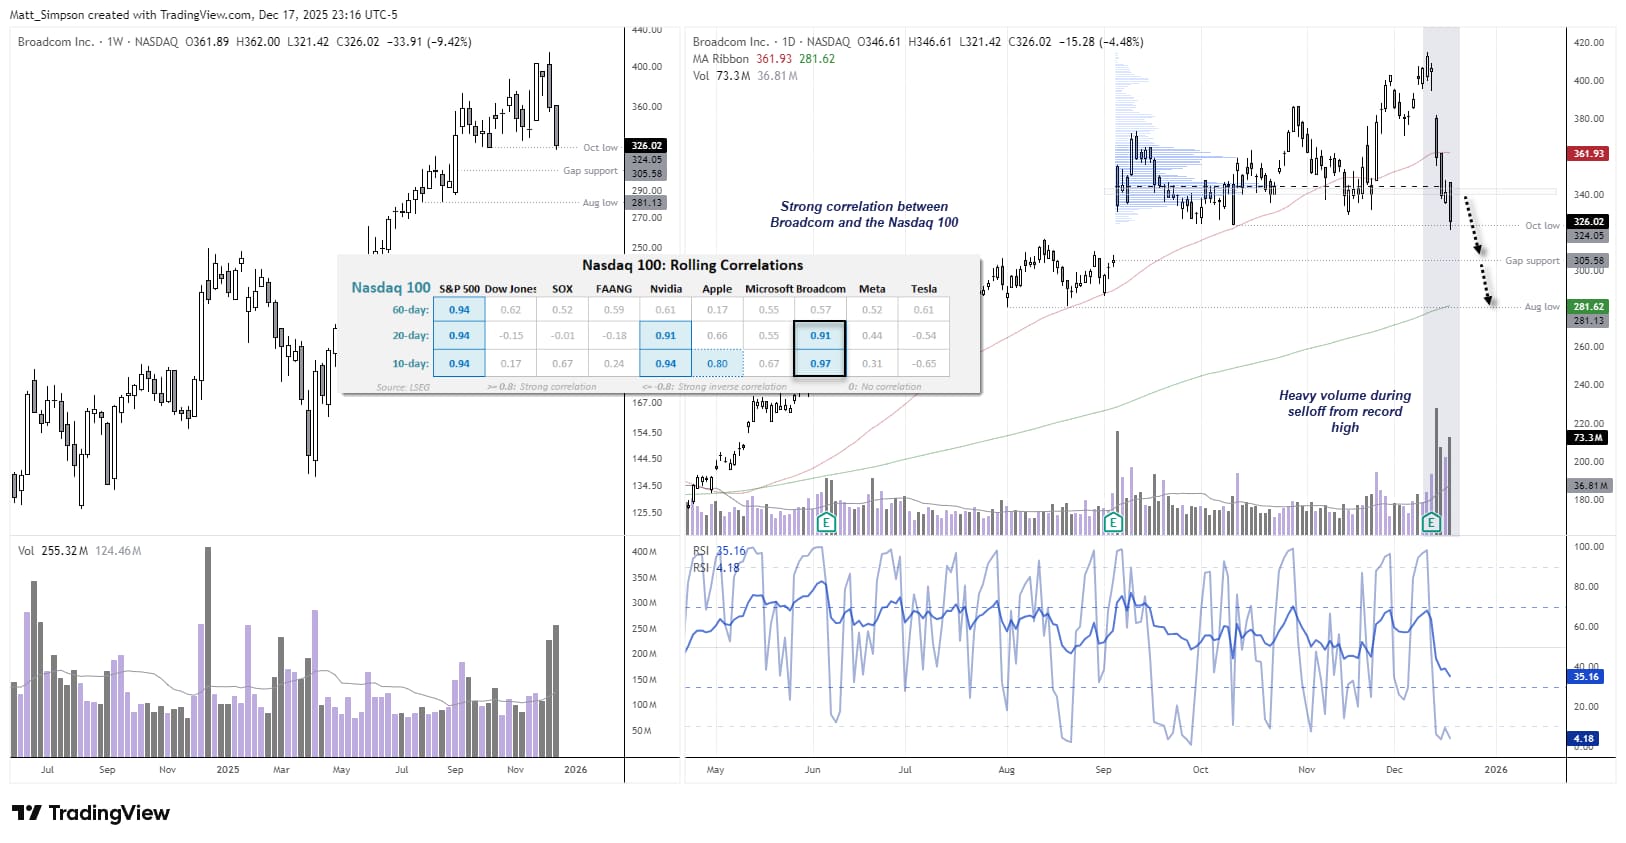
Chart analysis by Matt Simpson - data source: TradingView


Palantir (PLTR) Reversal Signal Near Key Resistance
I’ve been looking for the recent rally in Palantir (PLTR) to falter over the past couple of weeks, and Wednesday’s price action suggests it may finally be doing so. A bearish opening marubozu candle formed, with the session opening at the high and closing near the low — effectively a bearish engulfing day.
The signal carries more weight given it formed near the August high and the October VPOC. This aligns with other warning signs, including a bearish RSI divergence and above-average volume on the day, both consistent with a potential reversal at resistance. It also follows last week’s narrow-range doji at the same level, reinforcing the idea of buyer exhaustion.
Bears could fade rallies into Wednesday’s range while prices remain capped below 190, keeping downside risks open. There is a visible gap just below 170 that could attract price, ahead of stronger support near the 200-day SMA and the prior swing low around 150.
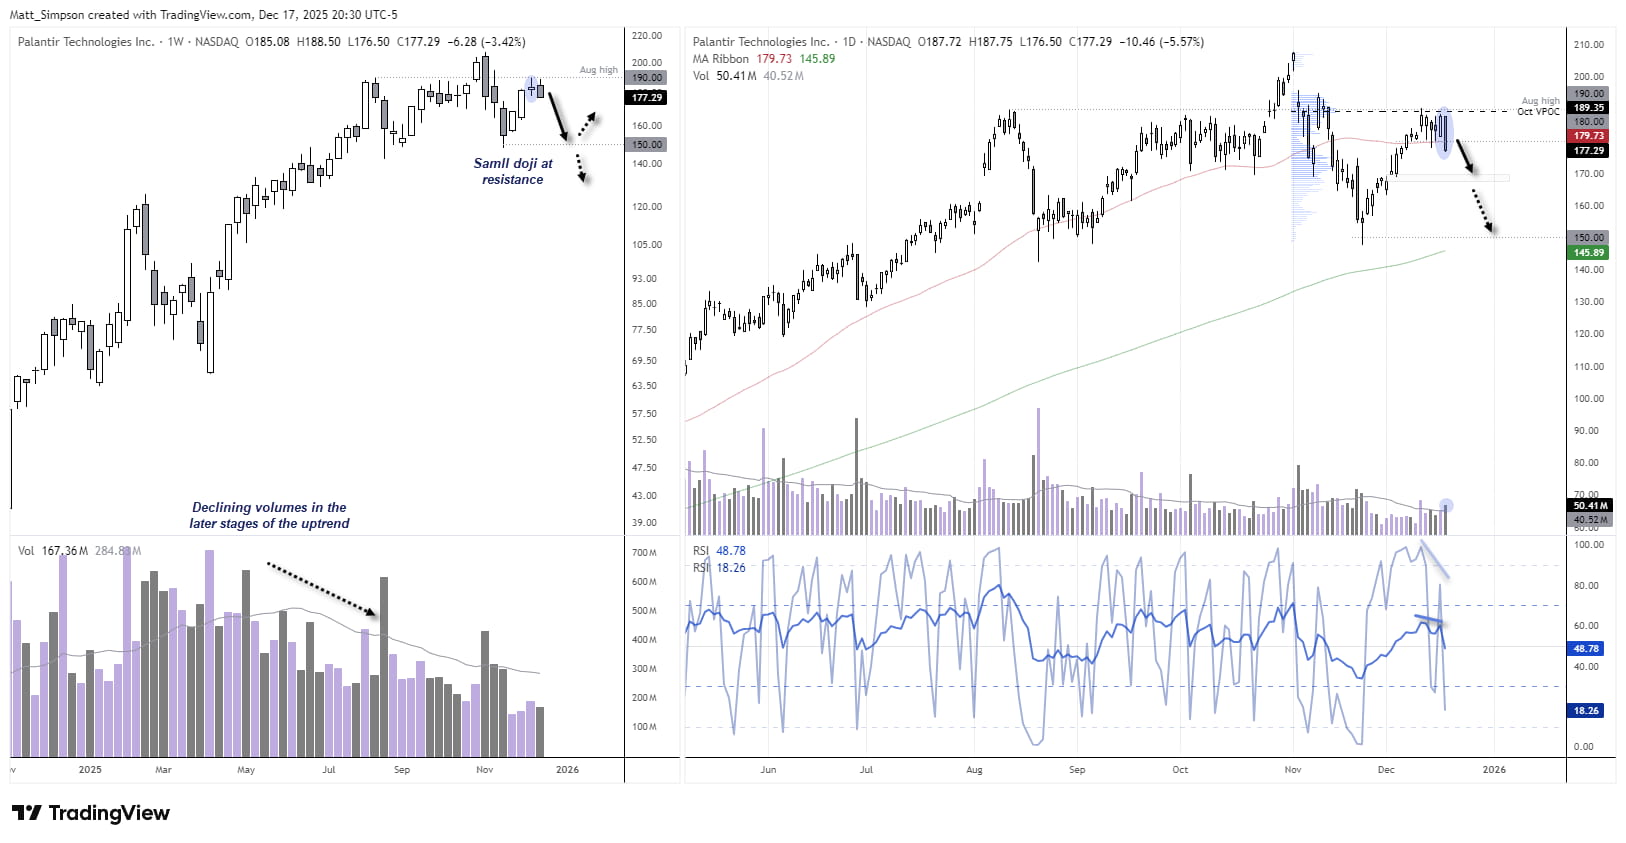
Chart analysis by Matt Simpson - data source: TradingView
View the full economic calendar
View the full economic calendar
-- Written by Matt Simpson
Follow Matt on Twitter @cLeverEdge
How to trade with City Index
You can trade with City Index by following these four easy steps:
- Open an account, or log in if you’re already a customer
• Open an account in the UK
• Open an account in Australia
• Open an account in Singapore
- Search for the market you want to trade in our award-winning platform
- Choose your position and size, and your stop and limit levels
- Place the trade
Latest market news




The complete CFD trading experience
Award-winning platforms, competitive spreads, low commissions and dedicated support.
We live and breathe the markets and are dedicated to helping traders realise their ambitions as we continue to set the industry bar.
Economic calendar
Web Trader platform
Our sophisticated web-based platform is packed with features.
Related articles
Magnificent Seven Earnings Preview: Is the AI Boom Facing Its Biggest Test Yet?
After a wobble in the broader AI trade, the Magnificent Seven" stocks are reporting earnings in the coming week - see the key themes and Nasdaq 100 levels to watch!

Nasdaq 100 forecast: Tech stocks not out of woods yet
US index futures pushed higher in the first half of Friday’s session, taking cues from a strong performance from European equities. Both European and US equity futures extending yesterday’s impressive recovery after the sharp sell-off earlier in the week. But the lingering concerns around the AI investment cycle remain, while bond markets were easing lower again, lifting yields.


ASX 200 Outlook: A Rates Trade Disguised as a Stock Market?
Australian bond futures have exhibited a far stronger relationship with the ASX 200 than Wall Street over recent months. Now both markets are displaying remarkably similar price structures.

StoneX Europe Ltd may make third party material available on this website which may contain information included but not limited to the conditions of financial markets. The material is for information purposes only and does not contain, and should not be construed as containing, investment advice and/or investment recommendation and/or an investment research and/or an offer of or solicitation for any transactions in financial instruments; any decision to enter into a specific transaction shall be made by the client following an assessment by him/her of their situation.
StoneX Europe Ltd makes no representation or warranty and assumes no liability as to the accuracy or completeness of the information provided, nor any loss arising from any investment based on a recommendation, forecast or other information supplied. You should always seek independent advice as to your suitability to speculate in any related markets and your ability to assume the associated risks, if you are at all unsure. We are not under any obligation to update any such material. Any opinion made may be personal to the author and may not reflect the opinion of StoneX Europe Ltd.