



USD/JPY Wrongfoots Bears Ahead of BoJ, Nikkei Looks in Trouble
USD/JPY squeezes higher despite a looming BoJ hike, while the Nikkei shows signs of a deeper corrective phase below 50,000.
Share this:

Volatility cut both ways for the euro and Swiss franc on Wednesday, while the US dollar was the strongest FX major. Sterling slid after soft UK inflation revived expectations of another Bank of England cut, while the US dollar firmed broadly ahead of key US data. Meanwhile, USD/JPY wrongfooted bears despite a widely expected Bank of Japan hike, and Nikkei futures showed signs of a deeper corrective phase.
View related analysis:
- USD/JPY and AUD/JPY Test Key Support as Japanese Yen Strengthens
- Australian Dollar Outlook: Momentum Fades as US Data Takes Centre Stage
- Japanese Yen Technical Outlook: USD/JPY, CHF/JPY, AUD/JPY
- Australian Dollar Outlook: Soft Jobs Cools AUD/USD Momentum
- Japanese Yen Weakness Lifts USD/JPY and EUR/JPY while Nikkei Holds 50k
View related analysis:
- USD/JPY and AUD/JPY Test Key Support as Japanese Yen Strengthens
- Australian Dollar Outlook: Momentum Fades as US Data Takes Centre Stage
- Japanese Yen Technical Outlook: USD/JPY, CHF/JPY, AUD/JPY
- Australian Dollar Outlook: Soft Jobs Cools AUD/USD Momentum
- Japanese Yen Weakness Lifts USD/JPY and EUR/JPY while Nikkei Holds 50k
USD/JPY and Nikkei Outlook Ahead of Key Central Bank Risk
It was a volatile day for the British pound after weak inflation data put another BoE rate cut firmly back on the radar, with markets pricing a near-100% chance of a 25bp cut on Thursday. GBP/USD fell as much as 0.9% before recouping around half of the day’s losses, leaving an elongated bearish hammer on the daily chart. AUD/USD fell for a fifth day during its most volatile session in a month, with a high-to-low range of 1.1%
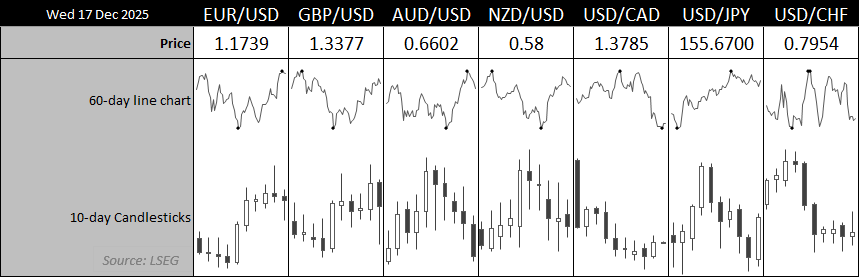
Chart analysis by Matt Simpson - data source: LSEG
Divisions within the Fed remain evident. Governor Waller again reiterated his preference for lower interest rates, contrasting with comments from Bostic the previous day, who argued a cut is not warranted. Market pricing is erring on the side of caution following last week’s not-so-dovish Fed cut, with the dot plot leaving room for just a single 25bp cut in 2026. Money markets price a 75.6% chance of a hold in January and a 44.8% chance of a 25bp cut in March.
Incoming data will shape those expectations, with CPI and jobless claims due today and consumer sentiment scheduled for Friday. The US dollar index was the strongest major currency on Thursday, while the Japanese yen was the weakest, despite expectations for the Bank of Japan to hike by 25bp tomorrow. The move appears fully priced, leaving little room for surprise unless the usually tight-lipped BoJ signals future cuts at the meeting — which looks unlikely.


USD/JPY Technical Analysis: US Dollar vs Japanese Yen
Despite expectations of a BoJ hike, options traders are turning more bullish on USD/JPY, with risk reversals rising to show calls gaining relative to puts. With the US dollar hinting at a swing low — printing a bullish pin bar on Wednesday followed by a small bullish candle on Thursday — and USD/JPY posting a solid bullish daily bar, upside risks appear greater than I anticipated in yesterday’s report.
The daily chart shows a decent rebound from support, keeping the 156.16 high in focus. However, a small rising wedge has formed on the 1-hour chart, alongside bearish divergences on both RSI (2) and RSI (14), which warns of a near-term pullback. Bulls could look to buy dips towards 155.29 or the broader 155.00–155.10 zone in anticipation of another leg higher. A break above 156.20 would open the door for a move back towards the 157 highs.
My bias on USD/JPY remains bullish while prices hold above 154.30. That said, the Bank of Japan meeting is tomorrow, which could lift volatility if policymakers deliver a hawkish hike and strengthen the Japanese yen (pushing USD/JPY lower).
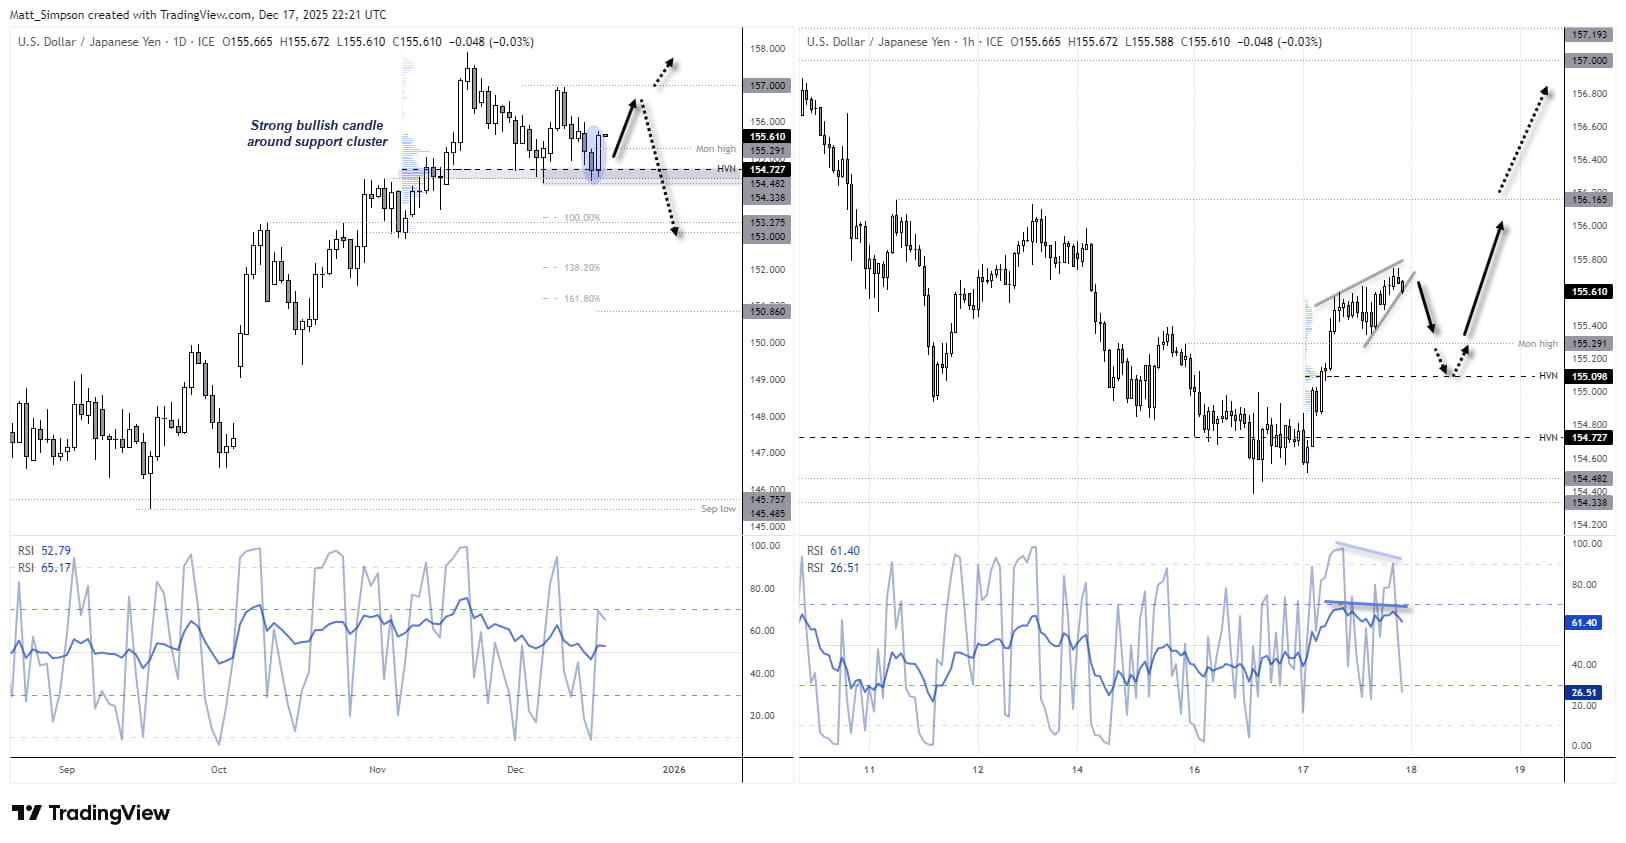
Chart analysis by Matt Simpson - data source: TradingView USD/JPY


Nikkei 225 Futures (NK) Technical Analysis
The Nikkei appears to be in a three-wave corrective phase following its strong rally above 50,000, which topped out in early November. Last week’s second consecutive (and minuscule) doji has been followed by a clear bout of bearish range expansion this week, signalling that the index has likely entered wave C of an ABC retracement.
This opens the door for a move below 48,000. A 100% projection of wave A measured from wave B sits just above 46,000, making it a plausible downside target for bears should 48,000 give way. The November low is now back in focus, particularly after the Nikkei met resistance near both its 50-day SMA and the psychologically important 50,000 handle.
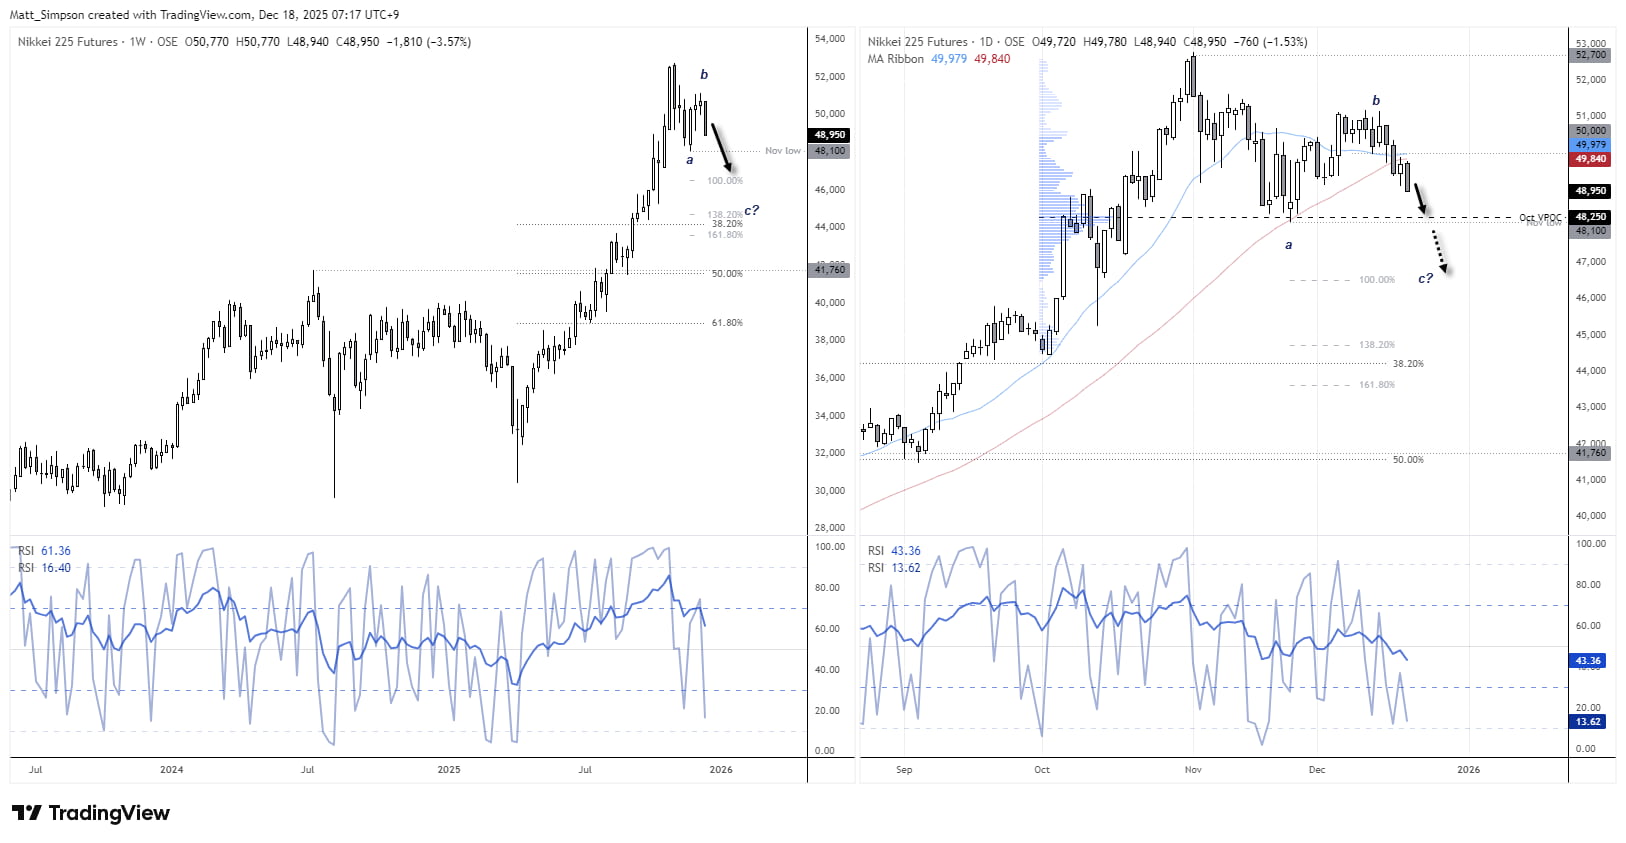
Chart analysis by Matt Simpson - Source: TradingView, Nikkei Futures (NKD1!)
View the full economic calendar
View the full economic calendar
-- Written by Matt Simpson
Follow Matt on Twitter @cLeverEdge
How to trade with City Index
You can trade with City Index by following these four easy steps:
- Open an account, or log in if you’re already a customer
• Open an account in the UK
• Open an account in Australia
• Open an account in Singapore
- Search for the market you want to trade in our award-winning platform
- Choose your position and size, and your stop and limit levels
- Place the trade
Related tags:
Latest market news




The complete CFD trading experience
Award-winning platforms, competitive spreads, low commissions and dedicated support.
We live and breathe the markets and are dedicated to helping traders realise their ambitions as we continue to set the industry bar.
Economic calendar
Web Trader platform
Our sophisticated web-based platform is packed with features.
Related articles
Magnificent Seven Earnings Preview: Is the AI Boom Facing Its Biggest Test Yet?
After a wobble in the broader AI trade, the Magnificent Seven" stocks are reporting earnings in the coming week - see the key themes and Nasdaq 100 levels to watch!

Nasdaq 100 forecast: Tech stocks not out of woods yet
US index futures pushed higher in the first half of Friday’s session, taking cues from a strong performance from European equities. Both European and US equity futures extending yesterday’s impressive recovery after the sharp sell-off earlier in the week. But the lingering concerns around the AI investment cycle remain, while bond markets were easing lower again, lifting yields.


ASX 200 Outlook: A Rates Trade Disguised as a Stock Market?
Australian bond futures have exhibited a far stronger relationship with the ASX 200 than Wall Street over recent months. Now both markets are displaying remarkably similar price structures.

StoneX Europe Ltd may make third party material available on this website which may contain information included but not limited to the conditions of financial markets. The material is for information purposes only and does not contain, and should not be construed as containing, investment advice and/or investment recommendation and/or an investment research and/or an offer of or solicitation for any transactions in financial instruments; any decision to enter into a specific transaction shall be made by the client following an assessment by him/her of their situation.
StoneX Europe Ltd makes no representation or warranty and assumes no liability as to the accuracy or completeness of the information provided, nor any loss arising from any investment based on a recommendation, forecast or other information supplied. You should always seek independent advice as to your suitability to speculate in any related markets and your ability to assume the associated risks, if you are at all unsure. We are not under any obligation to update any such material. Any opinion made may be personal to the author and may not reflect the opinion of StoneX Europe Ltd.