



USD/JPY and AUD/JPY Test Key Support as Japanese Yen Strengthens
Japanese yen strength pressures USD/JPY below 155 and drags AUD/JPY toward key support as traders assess downside risks.
Share this:

The Japanese yen is regaining traction, pushing USD/JPY and AUD/JPY toward key technical support levels. A softer US dollar backdrop and renewed focus on volatility have dragged USD/JPY below the closely watched 155 handle, while AUD/JPY has rolled over from multi-year highs. With both pairs probing pivotal levels, traders are now assessing whether yen strength extends or gives way to a corrective bounce.
View related analysis:
View related analysis:
Yen Strength Pressures USD/JPY and AUD/JPY at Key Support
November’s Nonfarm Payrolls report was mixed, though it slightly favoured doves as unemployment rose 0.2 percentage points to a four-year high of 4.6%. This marks a fourth consecutive monthly increase — the worst run since January 2009. While the 64k jobs added beat expectations of 50k and marked a sharp rebound from the prior -1.5k print – prompting some positive headlines for job growth - the broader trend is clearly pointing lower.
The US dollar was the weakest major currency on the day, with the Australian dollar a close second. The US dollar index traded down to a 42-day low before recouping around two-thirds of the session’s losses, leaving a potential bullish hammer on the daily chart.
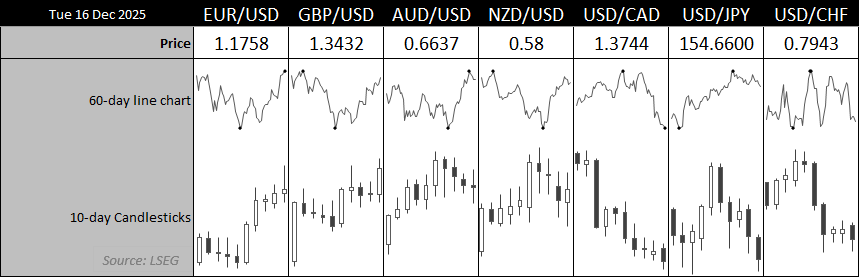
Chart analysis by Matt Simpson - source: LSEG
- EUR/USD formed a prominent shooting star near the 1.18 handle on the daily chart, hinting at bullish exhaustion and flagging the risk of a near-term retracement
- USD/CAD fell to a 65-day low, though support is nearby, with the August and September lows less than half a day’s average daily range away
- GBP/USD reached a 42-day high, with the British pound the strongest FX major on Tuesday
- USD/JPY slipped back below 155, leaving the October high in focus for bears to challenge
- AUD/USD fell for a fourth straight session, though a wide-legged doji formed and price held above the October high, hinting at a near-term swing low


USD/JPY Technical Analysis: US Dollar vs Japanese Yen
USD/JPY has posted its first daily close below 155 in a month. The level has drawn close attention since a former MOF official described it as a “line in the sand” for potential currency intervention a couple of years ago. That does not make 155 a hard trigger when crossed, but the risk of intervention increases if USD/JPY accelerates higher through it — particularly as the BOJ closely monitors volatility.
Regardless, the market clearly has a memory. The 155 handle has repeatedly acted as both support and resistance, making it a key reference point for yen traders. As such, a daily close beneath it is worth noting.
USD/JPY is now holding above last week’s low, though a break beneath it would likely open the door to a deeper retracement. The monthly S1 pivot sits near 153.28, making it a viable downside target for bears — or a level where bulls may reassess dips if downside momentum persists.
Still, a falling wedge is forming on the 4-hour chart, while a bearish divergence has developed on the RSI (2) within oversold territory. This leaves scope for a near-term bounce while prices hold above 154.34.
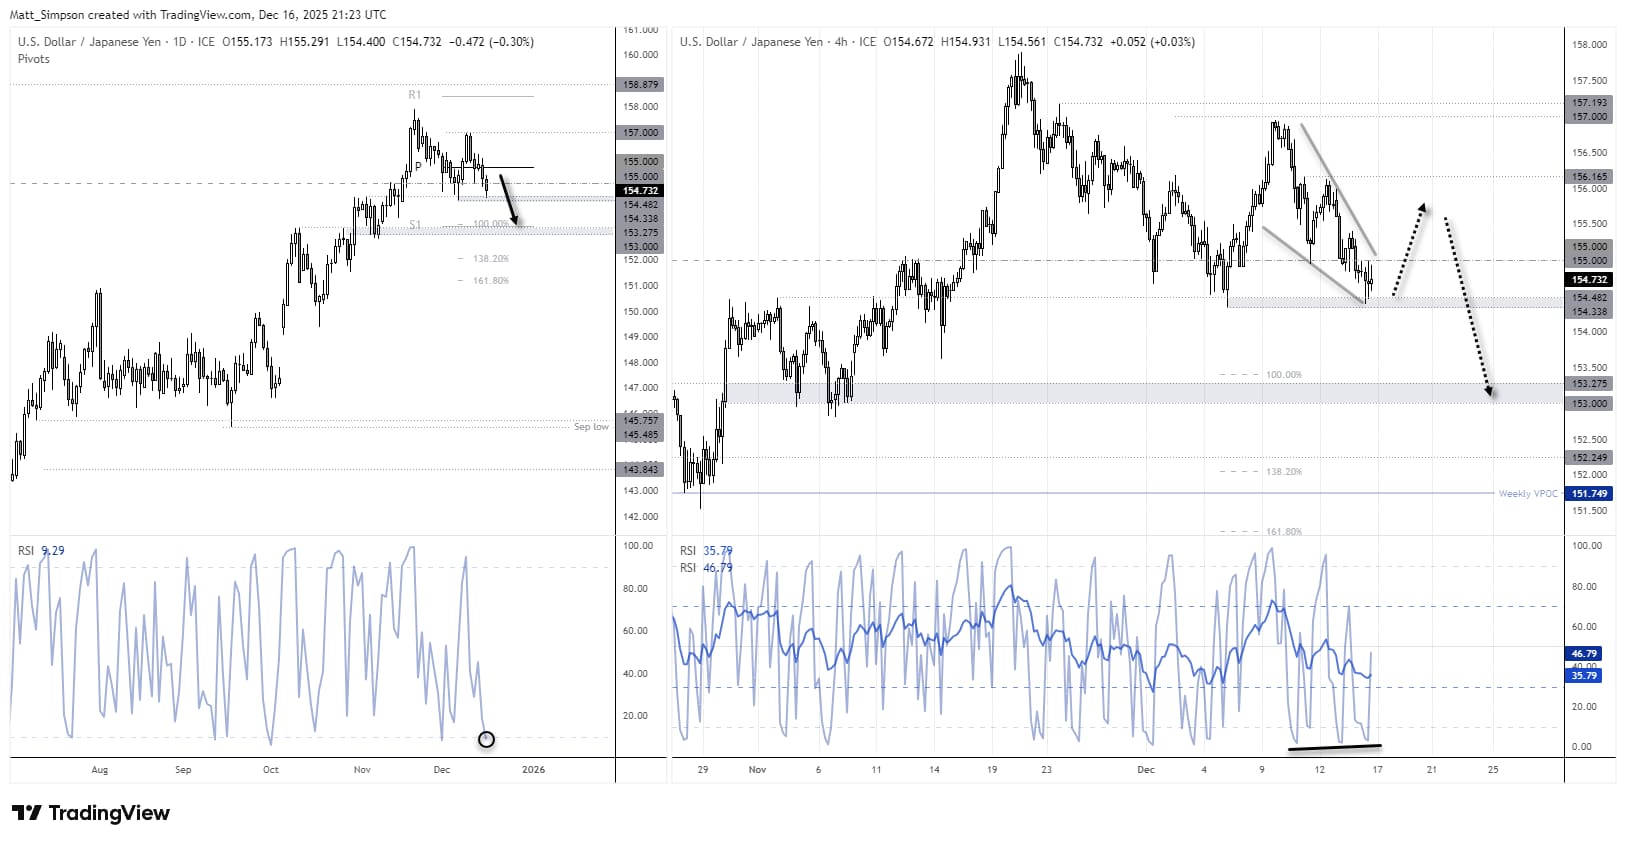
Chart analysis by Matt Simpson - data source: TradingView USD/JPY


AUD/JPY Technical Analysis: Australian Dollar vs Japanese Yen
The Australian dollar remains in a strong uptrend against the Japanese yen, with AUD/JPY reaching a 16-year high last week. However, the 2008 high proved a tough nut to crack, triggering a much-needed pullback. That retracement has produced five consecutive bearish daily candles — the first such sequence since August 2024.
Support is close at hand, with the November 2024 high, December VPOC and 20-day EMA clustered around the 102.50 area, making it a pivotal level for AUD/JPY traders. With the daily RSI (2) now stretched and a bullish pin bar alongside bullish divergence visible on the 4-hour chart, the pair may be able to muster a near-term bounce back towards the 103 handle.
That said, bearish momentum remains evident. Traders should stay alert to the risk of a break lower, which could open the door to a move towards the 102 handle or the 101.51 low.
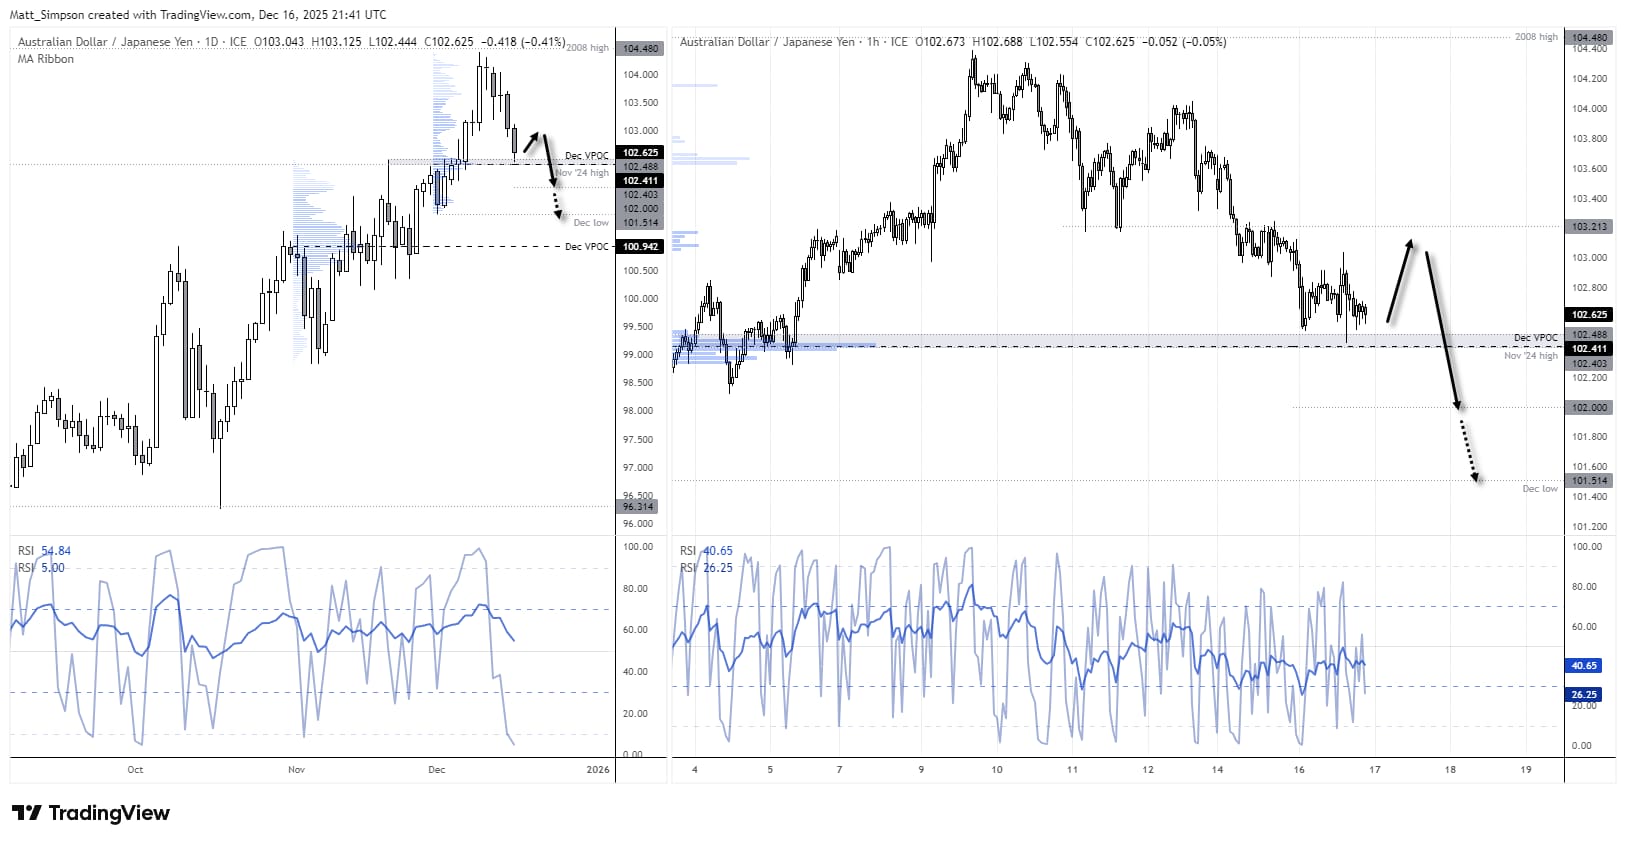
Chart analysis by Matt Simpson - source: TradingView AUD/JPY
View the full economic calendar
View the full economic calendar
-- Written by Matt Simpson
Follow Matt on Twitter @cLeverEdge
How to trade with City Index
You can trade with City Index by following these four easy steps:
- Open an account, or log in if you’re already a customer
• Open an account in the UK
• Open an account in Australia
• Open an account in Singapore
- Search for the market you want to trade in our award-winning platform
- Choose your position and size, and your stop and limit levels
- Place the trade
Related tags:
Latest market news




The complete CFD trading experience
Award-winning platforms, competitive spreads, low commissions and dedicated support.
We live and breathe the markets and are dedicated to helping traders realise their ambitions as we continue to set the industry bar.
Economic calendar
Web Trader platform
Our sophisticated web-based platform is packed with features.
Related articles
Swiss Franc Forecast: USD/CHF Seven-Week Rally Reverses From Yearly Highs 10 16 2026
A sharp rejection from fresh highs has shifted momentum in favor of USD/CHF bears, raising the stakes for a critical support test.
Nasdaq 100 forecast: Tech stocks not out of woods yet
US index futures pushed higher in the first half of Friday’s session, taking cues from a strong performance from European equities. Both European and US equity futures extending yesterday’s impressive recovery after the sharp sell-off earlier in the week. But the lingering concerns around the AI investment cycle remain, while bond markets were easing lower again, lifting yields.


ASX 200 Outlook: A Rates Trade Disguised as a Stock Market?
Australian bond futures have exhibited a far stronger relationship with the ASX 200 than Wall Street over recent months. Now both markets are displaying remarkably similar price structures.

StoneX Europe Ltd may make third party material available on this website which may contain information included but not limited to the conditions of financial markets. The material is for information purposes only and does not contain, and should not be construed as containing, investment advice and/or investment recommendation and/or an investment research and/or an offer of or solicitation for any transactions in financial instruments; any decision to enter into a specific transaction shall be made by the client following an assessment by him/her of their situation.
StoneX Europe Ltd makes no representation or warranty and assumes no liability as to the accuracy or completeness of the information provided, nor any loss arising from any investment based on a recommendation, forecast or other information supplied. You should always seek independent advice as to your suitability to speculate in any related markets and your ability to assume the associated risks, if you are at all unsure. We are not under any obligation to update any such material. Any opinion made may be personal to the author and may not reflect the opinion of StoneX Europe Ltd.