



Japanese Yen Weakness Lifts USD/JPY and EUR/JPY while Nikkei Holds 50k
Yen softness extends across major FX pairs, boosting USD/JPY and EUR/JPY while the Nikkei consolidates above 50,000 ahead of key central bank catalysts.
Share this:

The Japanese yen and Swiss franc were the weakest FX majors on Monday, supporting the bullish biases I outlined last week on USD/JPY and USD/CHF. USD/CHF has climbed to an 8-day high and now trades roughly 30 pips below my 0.81 upside target. Momentum has also turned higher on USD/JPY, consistent with last week’s bullish view.
GBP/JPY broke to a 16-month high and now sits just 40 pips beneath its July 2024 peak.
NZD/JPY reached a 13-month high, while AUD/JPY hit a 17-month high ahead of today’s RBA meeting, where a hawkish hold is expected.
The US dollar index is holding above last week’s lows and printed a bullish candle on Monday, though meaningful follow-through is still lacking. That could change later this week if the Fed proves less dovish than some expect.
View related analysis:
View related analysis:
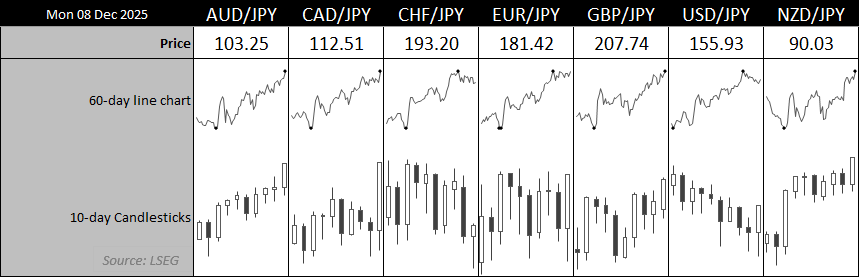
Chart analysis by Matt Simpson - data source: LSEG
USD/JPY Technical Analysis: US Dollar vs Japanese Yen
The daily chart on the left shows that bulls have finally made their presence felt on USD/JPY after an 11-day correction from the November high. Two bullish hammers formed on Thursday and Friday around the October high, accompanied by a bullish divergence on the RSI(2). The RSI(14) also held above 50 throughout the pullback and is now turning higher.
Importantly, USD/JPY continued to close above the 155 handle — a level many traders consider sensitive for potential MOF scrutiny. Historically, though, intervention risk rises more on disorderly volatility than on any specific price level.
The 1-hour chart on the right shows a developing bullish trend, marked by higher highs and higher lows while price continues to respect the 10-bar EMA as dynamic support. USD/JPY looks set to test the weekly R1 pivot at 156.20 and the high-volume node near 156.35. Whether it can break and sustain above these levels will likely depend on how hawkish the market perceives the upcoming FOMC meeting. A clean break above 156.50 would open the door for a run towards the 157 handle.
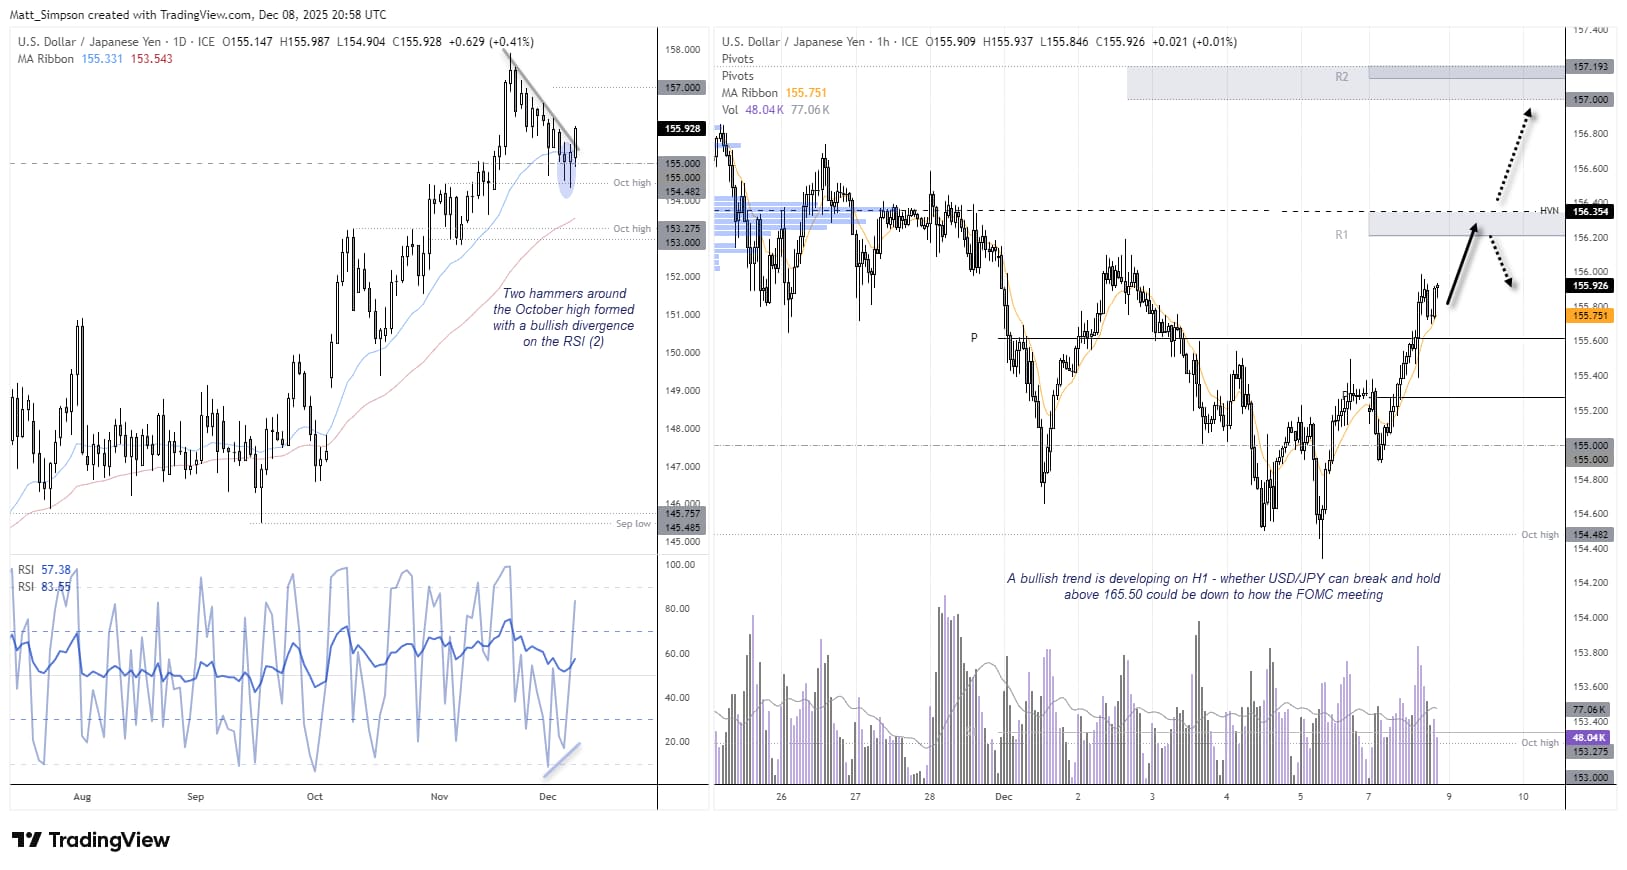
Chart analysis by Matt Simpson - data source: TradingView USD/JPY


EUR/JPY Technical Analysis: Euro vs Japanese Yen
The euro remains in a strong uptrend against the yen, with momentum turning higher after a bullish continuation pattern on the EUR/JPY daily chart. The symmetrical triangle now projects an upside target just above the 183 handle, aligning with the monthly R1 pivot at 183.46. The daily RSI(14) also remains comfortably above 50 and is curling higher without entering overbought territory.
EUR/JPY is also trending higher on the 1-hour chart, with price now pressing against the weekly R1 pivot and the recent swing high at 181.52. A clean break above this zone would shift focus towards the November high at 182.00 and the weekly R2 pivot at 182.15, with the symmetrical triangle target further above.
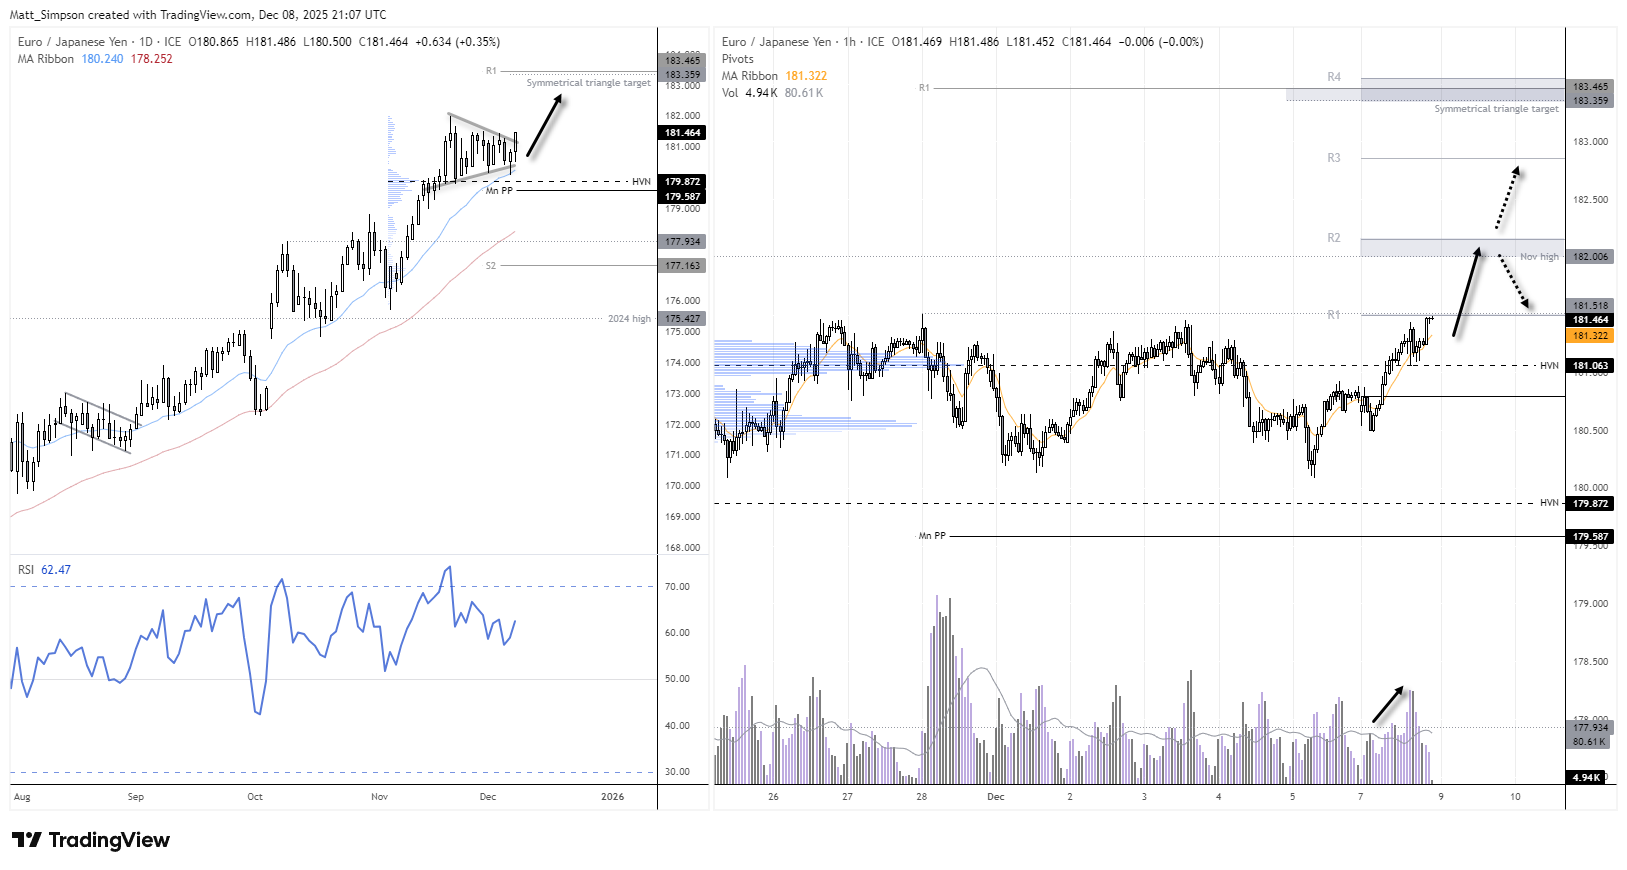
Chart analysis by Matt Simpson - data source: TradingView EUR/JPY


Nikkei 225 Futures (NK) Technical Analysis
While the 10-day correlation between USD/JPY and the Nikkei is virtually flat at 0.1 — and still low at 0.4 over 20 days — correlations are inherently lagging. The 60-day reading, however, is very strong at 0.9. With USD/JPY pushing higher and the Nikkei holding elevated levels, the risk is that shorter-term correlations begin to tighten again.
The daily chart shows that, despite short-term noise, USD/JPY and the Nikkei tend to move broadly in tandem over time.
Rising volumes supported the two-day bullish breakout on the Nikkei last week, while volume has since tapered off as prices consolidate above the 20-day EMA and the 50k handle within what appears to be a developing pennant/flag pattern. Bulls may seek pullbacks into last week’s range or towards the 20-day EMA, positioning for a potential continuation towards the 52k area.

 Chart analysis by Matt Simpson - Source: TradingView, Nikkei Futures (NKD1!)
View the full economic calendar
View the full economic calendar
-- Written by Matt Simpson
Follow Matt on Twitter @cLeverEdge
How to trade with City Index
You can trade with City Index by following these four easy steps:
- Open an account, or log in if you’re already a customer
• Open an account in the UK
• Open an account in Australia
• Open an account in Singapore
- Search for the market you want to trade in our award-winning platform
- Choose your position and size, and your stop and limit levels
- Place the trade
Related tags:
Latest market news




The complete CFD trading experience
Award-winning platforms, competitive spreads, low commissions and dedicated support.
We live and breathe the markets and are dedicated to helping traders realise their ambitions as we continue to set the industry bar.
Economic calendar
Web Trader platform
Our sophisticated web-based platform is packed with features.
Related articles
Swiss Franc Forecast: USD/CHF Seven-Week Rally Reverses From Yearly Highs 10 16 2026
A sharp rejection from fresh highs has shifted momentum in favor of USD/CHF bears, raising the stakes for a critical support test.

AUD/USD Bulls Fight Back After Australian Jobs Shock
AUD/USD has been hit by another ugly Australian employment report, sending RBA rate hike expectations sharply lower. Yet the relationships driving the currency have shifted since quarter-end, and improving risk appetite could provide the fuel for a recovery.


USD/JPY Update: Can the Japanese Yen Sustain Its Recovery?
Short-term price action around the Japanese yen has started to show some relative improvement over recent sessions. This can be seen in the recent performance of USD/JPY, which has now recorded three consecutive daily declines in favor of the Japanese currency, resulting in a depreciation of roughly 0.35% over the period.

StoneX Europe Ltd may make third party material available on this website which may contain information included but not limited to the conditions of financial markets. The material is for information purposes only and does not contain, and should not be construed as containing, investment advice and/or investment recommendation and/or an investment research and/or an offer of or solicitation for any transactions in financial instruments; any decision to enter into a specific transaction shall be made by the client following an assessment by him/her of their situation.
StoneX Europe Ltd makes no representation or warranty and assumes no liability as to the accuracy or completeness of the information provided, nor any loss arising from any investment based on a recommendation, forecast or other information supplied. You should always seek independent advice as to your suitability to speculate in any related markets and your ability to assume the associated risks, if you are at all unsure. We are not under any obligation to update any such material. Any opinion made may be personal to the author and may not reflect the opinion of StoneX Europe Ltd.