



US Dollar Shows Signs of Stability Into PCE Inflation: USD/JPY, USD/CHF
US dollar steadies ahead of PCE inflation, with USD/JPY and USD/CHF showing bullish signals as traders reassess the Fed’s December rate-cut path.
Share this:

Most would agree that the Fed are likely cut rates by 25bp this month, though their tone around future cuts remains up in the air as the backlog of economic data flows in. The bearish excitement that weak ADP payrolls figures generated for the US dollar took a pause for breath on Thursday, as job layoffs didn’t spike as bears had hoped. Instead, the US dollar rose 0.17% to break a 4-day losing streak and close back above support. ISM services PMI also show the US economy continues to grow, so it is plausible to expect the Fed to deliver a cautious cut at this stage.
And that means US dollar bears may want to tread carefully in the near term, with US economic data still pointing to a slowdown rather than a recession. Traders will be watching PCE inflation closely today; whichever side of expectations it lands on is likely to dictate the dollar’s direction into the weekend — and whether it can muster any kind of bounce.
View related analysis:
View related analysis:
US Dollar Index (DXY) Technical Analysis
I’ve outlined my bearish case for the US dollar in prior analysis, based on the view that the bullish rally from the 2011 low peaked at 110.35 in 2022. The lower high in January looks like the start of an impulsive move lower, while the current three-wave rally from the June low appears to be an ABC correction — with the market now trying to define the end of wave C.
The weekly chart is on track for a second consecutive decline. It’s possible wave C has already topped, and seasonality — with the US dollar typically weakening in the second half of December — strengthens that case. But if US economic data doesn’t soften as much as bears hope, DXY remains vulnerable to a move towards 101. Traders should stay nimble and be prepared for knee-jerk reactions along the way.
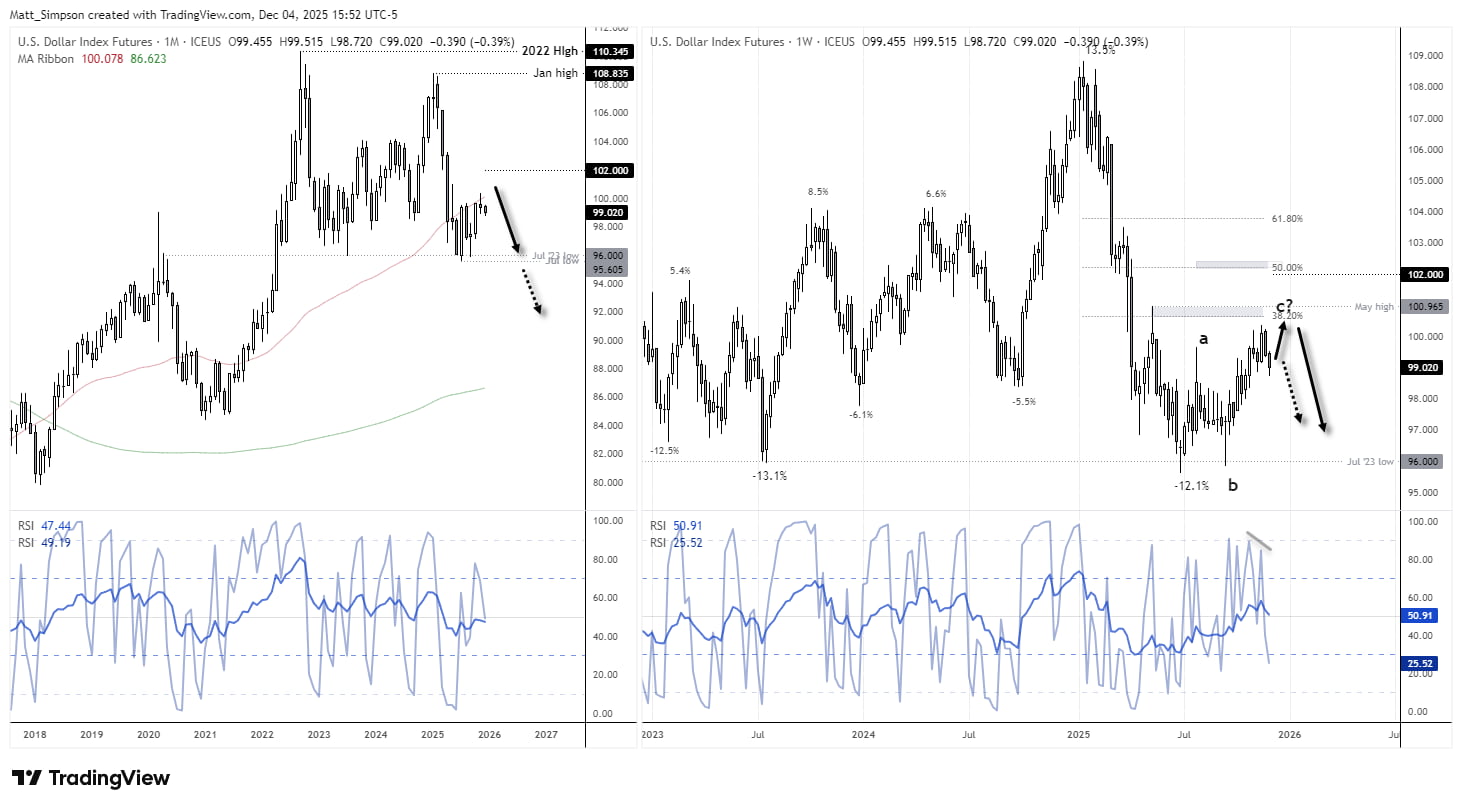
Chart analysis by Matt Simpson - data source: TradingView U.S. Dollar Index Futures


US Dollar Index (DXY) Daily Chart
The daily chart shows a small bullish candle forming on Thursday, which may mark a false break beneath the 98.87 low. RSI(2) was extremely oversold on Wednesday, and price has since recovered back above the 200- and 50-day SMAs.
A bounce looks likely in the near term, with the 200-day EMA (99.32) or 99.50 serving as realistic resistance levels for bulls. A push towards 100 or higher would require PCE inflation — and subsequent data — to surprise to the upside, although that currently seems less likely given the dollar’s tendency to weaken in the second half of December.
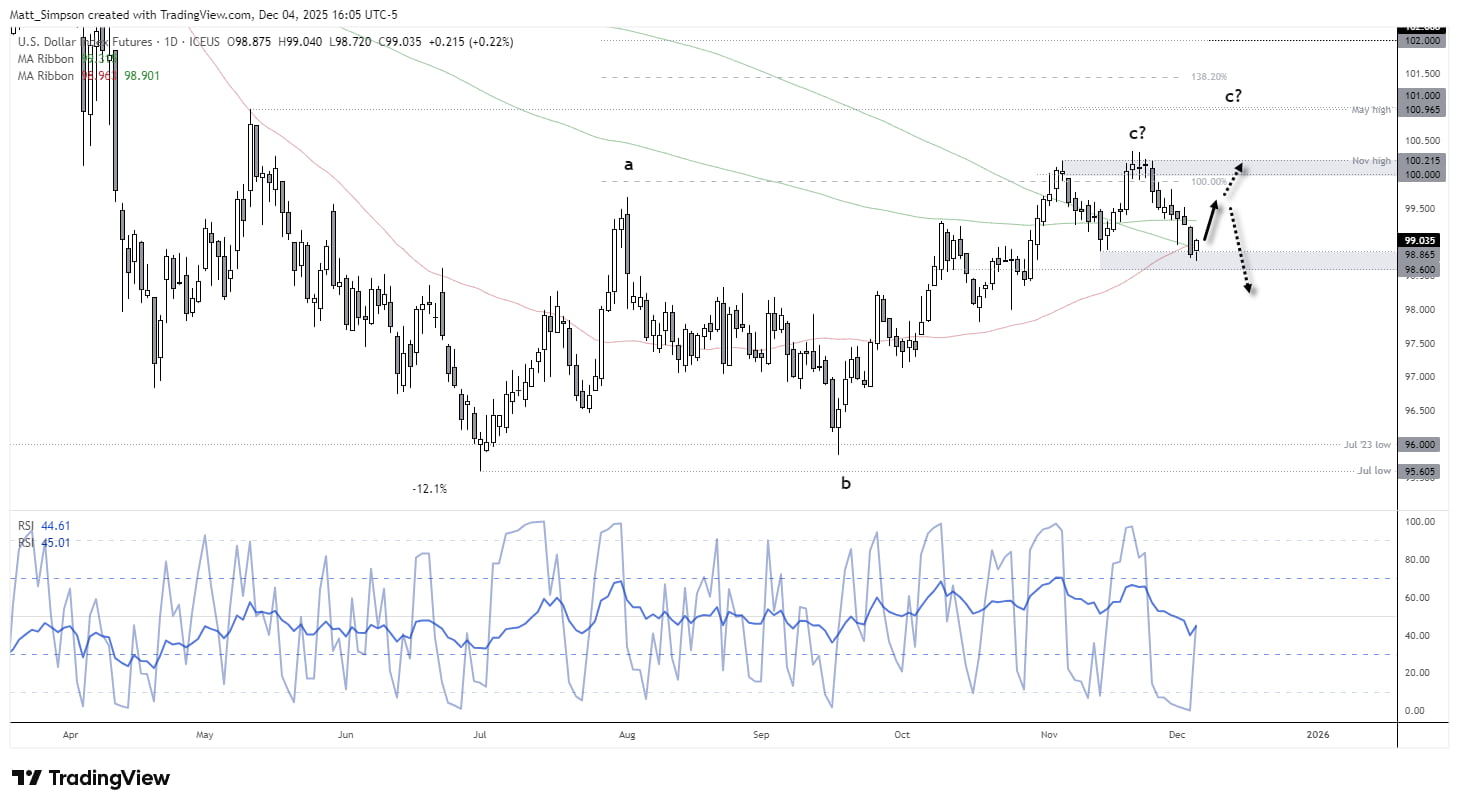
Chart analysis by Matt Simpson - data source: TradingView U.S. Dollar Index Futures


USD/JPY Technical Analysis: US Dollar vs Japanese Yen
Like it or not, USD/JPY remains in an uptrend on the daily chart. Despite the occasional murmur of a more hawkish BOJ, officials are not signalling a rate hike yet — and that means meaningful yen strength is still absent.
The daily chart shows a spinning-top doji forming around the October high, with price closing just above the 155 handle — a level markets previously monitored for potential intervention. A small bullish divergence has also appeared on RSI(2).
On the 4-hour chart, a clearer bullish divergence is visible on RSI(14). Volume also increased as price lifted from the 4-hour doji, hinting at bullish initiation. This keeps the bias pointed towards 155.50 initially, with the 156 handle and the high-volume node (HVN) at 156.35 also within reach.
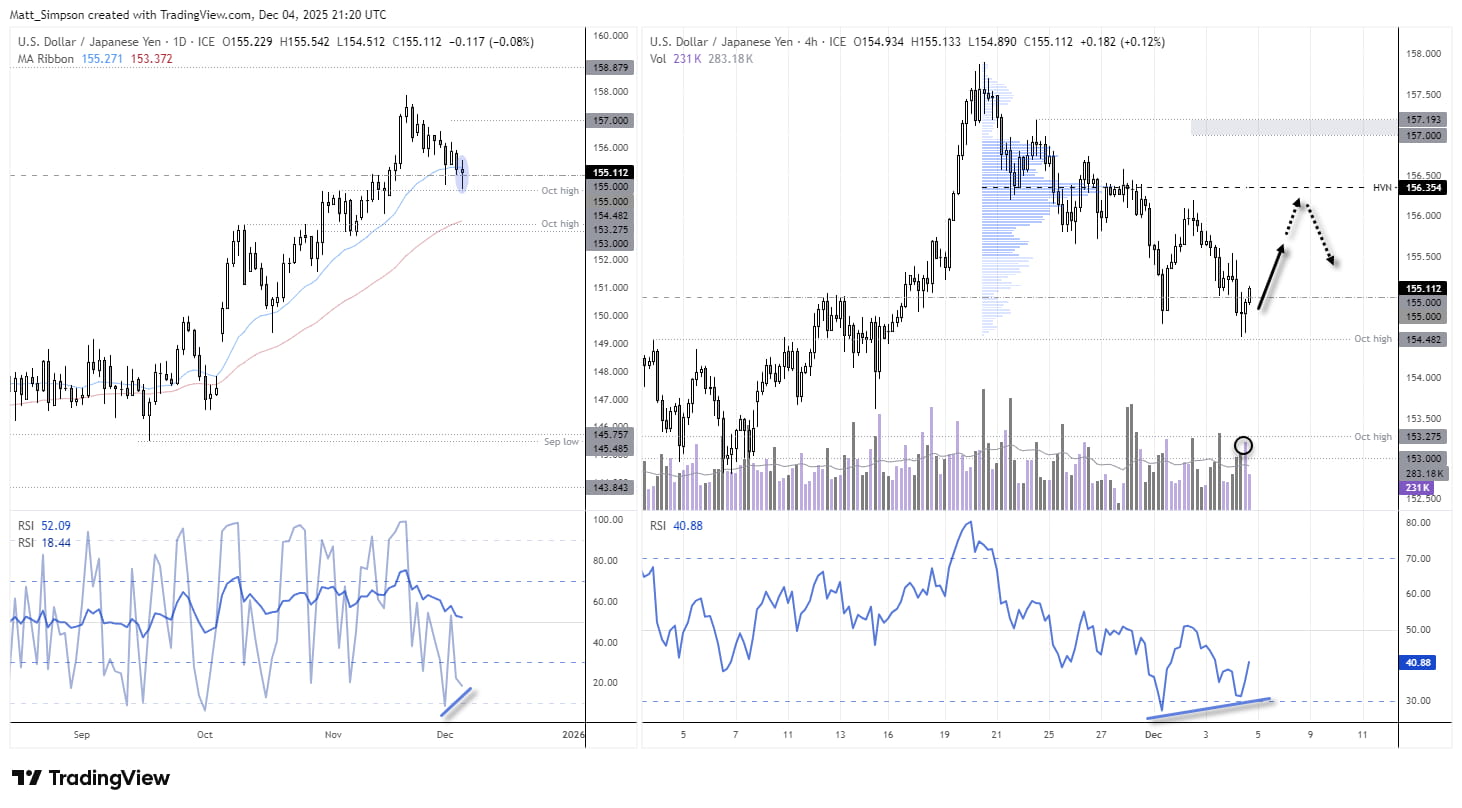
Chart analysis by Matt Simpson - data source: TradingView USD/JPY


USD/CHF Technical Analysis: US Dollar vs Swiss Franc
Another chart for US dollar bulls to keep an eye on is USD/CHF. A bullish engulfing candle formed on Thursday, closing back above the monthly pivot point, the 50-day EMA, and the 20-day EMA. Notably, range expansion kicked in after a brief dip around 0.80.
On the 4-hour chart, momentum has turned higher following its multi-day pullback, implying a near-term move towards 0.81 is achievable.
However, the high-volume node (HVN) at 0.8048 may act as resistance initially and offer a potential pullback zone for bulls looking to buy dips within Thursday’s range.
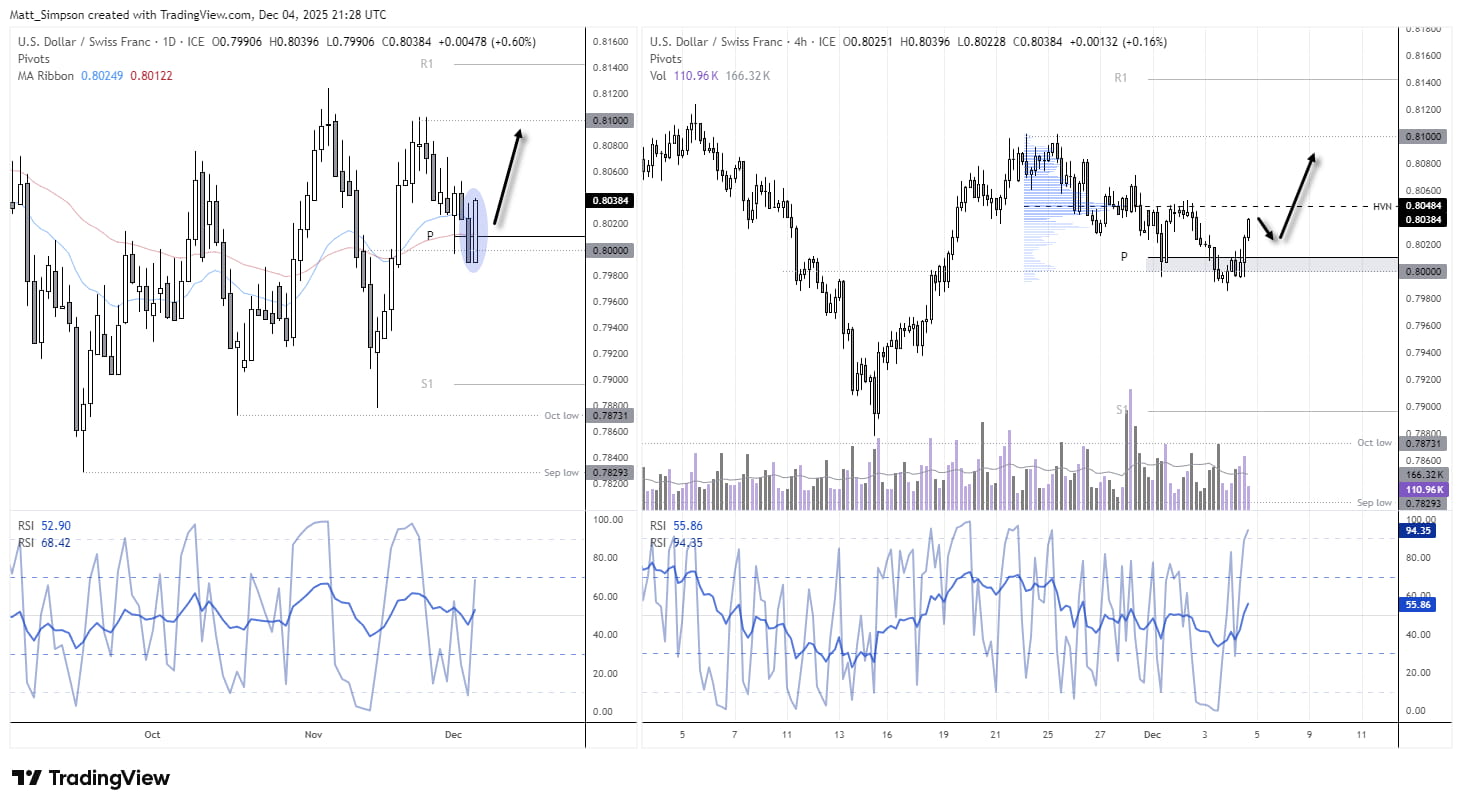
Chart analysis by Matt Simpson - data source: TradingView USD/CHF
View the full economic calendar
View the full economic calendar
-- Written by Matt Simpson
Follow Matt on Twitter @cLeverEdge
How to trade with City Index
You can trade with City Index by following these four easy steps:
- Open an account, or log in if you’re already a customer
• Open an account in the UK
• Open an account in Australia
• Open an account in Singapore
- Search for the market you want to trade in our award-winning platform
- Choose your position and size, and your stop and limit levels
- Place the trade
Related tags:
Latest market news




The complete CFD trading experience
Award-winning platforms, competitive spreads, low commissions and dedicated support.
We live and breathe the markets and are dedicated to helping traders realise their ambitions as we continue to set the industry bar.
Economic calendar
Web Trader platform
Our sophisticated web-based platform is packed with features.
Related articles
Swiss Franc Forecast: USD/CHF Seven-Week Rally Reverses From Yearly Highs 10 16 2026
A sharp rejection from fresh highs has shifted momentum in favor of USD/CHF bears, raising the stakes for a critical support test.

Nasdaq 100 forecast: Tech stocks not out of woods yet
US index futures pushed higher in the first half of Friday’s session, taking cues from a strong performance from European equities. Both European and US equity futures extending yesterday’s impressive recovery after the sharp sell-off earlier in the week. But the lingering concerns around the AI investment cycle remain, while bond markets were easing lower again, lifting yields.


ASX 200 Outlook: A Rates Trade Disguised as a Stock Market?
Australian bond futures have exhibited a far stronger relationship with the ASX 200 than Wall Street over recent months. Now both markets are displaying remarkably similar price structures.

StoneX Europe Ltd may make third party material available on this website which may contain information included but not limited to the conditions of financial markets. The material is for information purposes only and does not contain, and should not be construed as containing, investment advice and/or investment recommendation and/or an investment research and/or an offer of or solicitation for any transactions in financial instruments; any decision to enter into a specific transaction shall be made by the client following an assessment by him/her of their situation.
StoneX Europe Ltd makes no representation or warranty and assumes no liability as to the accuracy or completeness of the information provided, nor any loss arising from any investment based on a recommendation, forecast or other information supplied. You should always seek independent advice as to your suitability to speculate in any related markets and your ability to assume the associated risks, if you are at all unsure. We are not under any obligation to update any such material. Any opinion made may be personal to the author and may not reflect the opinion of StoneX Europe Ltd.