



US Dollar Seasonality in December: USD/JPY, USD/CHF, EUR/USD, AUD/USD
See how the US dollar typically performs in December, which FX pairs show the strongest seasonal trends, and where bullish or bearish patterns tend to cluster.
Share this:

Seasonal patterns can complement other forms of analysis, but they’re far from a roadmap. They’re simply averages of historical returns that highlight periods where markets have tended to outperform or underperform — and those patterns can shift or fail altogether.
Macro events can easily override any seasonal bias, so seasonality is best treated as a secondary signal that only holds weight when it aligns with broader evidence.
That said, December does offer some of the more reliable tendencies for traders. Santa’s rally is well-known on Wall Street, but FX markets also display recurring behaviour at this time of year. Below, we look at how the major currency pairs typically perform against the US dollar in December, before drilling into daily patterns for each of the key USD crosses.
View related analysis:
View related analysis:
December Seasonality Trends for the US Dollar
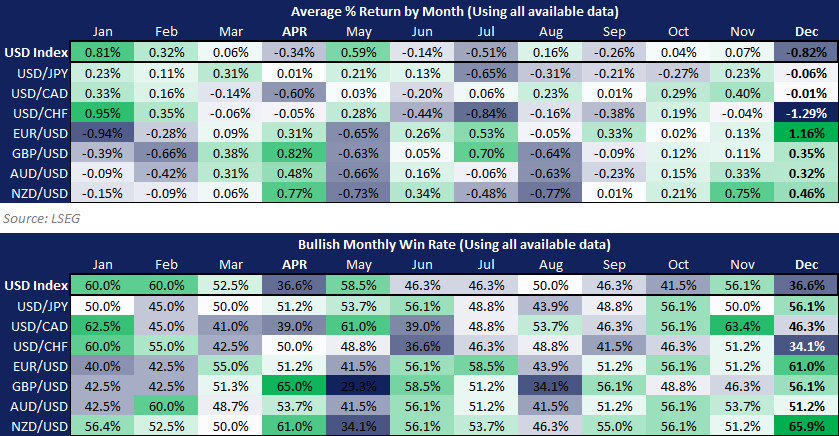
Using data from LSEG, I’ve compared monthly percentage returns for the US Dollar Index alongside each major currency pair. The lower table also shows the ‘bullish win rate’ for each month — simply the percentage of times a market closed higher.
The ideal bullish setup is a positive average return combined with a win rate above 50%. Bears, meanwhile, look for negative average returns alongside bullish win rates below 50%. The more extreme the readings, the stronger the underlying seasonality.
Charts prepared by Matt Simpson, Source: LSEG
Swiss franc (CHF) and euro (EUR) tend to dominate the US dollar in December
- USD/CHF is the standout, with an average December return of -1.29%, reflecting consistent Swiss franc strength.
- Its 34.1% win rate means USD/CHF has closed lower nearly 66% of the time in December.
- The euro isn’t far behind: EUR/USD averages +1.16% with a 61% win rate.
- This largely reflects a softer US dollar, with the USD Index averaging -0.82% in December and recording a low 36.6% win rate (a 63.4% “lose rate”).
- NZD/USD, AUD/USD and GBP/USD also tend to rise in December, though more modestly at 0.46%, 0.32% and 0.35% respectively.
- Win rates vary: NZD/USD is strongest at 65.9%, while GBP/USD sits at 56.1%, and AUD/USD is only slightly above neutral at 51.2%.
- December’s seasonality is largely absent in USD/JPY and USD/CAD, which show average returns of -0.06% and +0.01% respectively.


US Dollar Index (USD) Seasonality for December
What I’m really looking for is a run of days where the average return and the win rate point in the same direction — either both positive or both negative. While you can pick out individual days in a month that appear to meet that criteria, drilling down too closely makes the analysis vulnerable to intra-month noise and false signals. Ideally, I want to see at least three consecutive days before treating it as a meaningful pattern.
From 22 December onwards, there’s a clear negative bias for the US dollar. However, only the two days either side of Christmas Day also show negative win rates.
There’s also a three-day period from 10–12 December where both the average return and the win rate are negative, although the signal on the 10th is marginal.

Charts prepared by Matt Simpson, Source: CME, LSEG
USD/CHF (US Dollar vs Swiss Franc) Seasonality for December
The Swiss franc is the strongest major in December, but its daily return profile shows a slightly different pattern to the broader US dollar index. The most consistent bearish stretch for USD/CHF actually appears between Christmas and New Year, particularly from 27–30 December.
There’s also a three-day bearish cluster from 10–12 December, similar to the USD Index, and USD/CHF typically starts the month on a soft note.
Importantly, there isn’t a single instance of two or more consecutive days where bullish average returns align with a win rate above 50%.
Note the negative win rate on New Year’s eve, presumably as traders square up their books.

Charts prepared by Matt Simpson, Source: CME, LSEG


EUR/USD (Euro vs US Dollar) Seasonality for December
Unsurprisingly, EUR/USD largely mirrors the USD Index, given its weight of around 57% in the basket. The strongest bullish stretch typically runs from 22–27 December, and this momentum can spill into New Year’s Eve — although 31 December carries a negative win rate.
16 December stands out as the most statistically bullish single day, with the strongest average return and a win rate close to 70%. This may be influenced by the final FOMC meeting of the year, though — as always — single-day seasonality should be treated with caution.
EUR/USD also tends to start the month on a firm footing, recording a three-day positive cluster from 10–12 December with supportive win rates.

Charts prepared by Matt Simpson, Source: LSEG
USD/JPY (US Dollar vs Japanese Yen) Seasonality for December
December’s overall return profile for the yen is broadly flat across the sample, but there are a few notable tendencies. USD/JPY shows consistently negative average returns over the final four days of the month, with the first three of those days also posting win rates below 50%.
Another point of interest is the sharp negative returns on 16 and 17 December, both accompanied by low win rates of roughly 26% and 32% respectively.

Charts prepared by Matt Simpson, Source: LSEG


AUD/USD (Australian Dollar vs US Dollar) Seasonality for December
For completeness — and given the tendency for risk appetite to firm around Christmas — it’s worth highlighting the Australian dollar. AUD/USD shows a strong tendency to rise into the New Year, with average returns steadily increasing from 23–31 December. Win rates are also consistently supportive during this period, with several days posting 60–70%+ bullish probabilities.

Charts prepared by Matt Simpson, Source: LSEG
View the full economic calendar
View the full economic calendar
-- Written by Matt Simpson
Follow Matt on Twitter @cLeverEdge
How to trade with City Index
You can trade with City Index by following these four easy steps:
- Open an account, or log in if you’re already a customer
• Open an account in the UK
• Open an account in Australia
• Open an account in Singapore
- Search for the market you want to trade in our award-winning platform
- Choose your position and size, and your stop and limit levels
- Place the trade
Latest market news




The complete CFD trading experience
Award-winning platforms, competitive spreads, low commissions and dedicated support.
We live and breathe the markets and are dedicated to helping traders realise their ambitions as we continue to set the industry bar.
Economic calendar
Web Trader platform
Our sophisticated web-based platform is packed with features.
Related articles
Swiss Franc Forecast: USD/CHF Seven-Week Rally Reverses From Yearly Highs 10 16 2026
A sharp rejection from fresh highs has shifted momentum in favor of USD/CHF bears, raising the stakes for a critical support test.


EUR/USD, GBP/USD Price Outlook: Can the Dollar Pullback Fuel a Bullish Rebound?
Could EUR/USD and GBP/USD be confirming a bullish rebound? The DXY’s pullback from the 103 resistance level may support a recovery in both pairs, although confirmation is still needed.


AUD/USD Bulls Fight Back After Australian Jobs Shock
AUD/USD has been hit by another ugly Australian employment report, sending RBA rate hike expectations sharply lower. Yet the relationships driving the currency have shifted since quarter-end, and improving risk appetite could provide the fuel for a recovery.

StoneX Europe Ltd may make third party material available on this website which may contain information included but not limited to the conditions of financial markets. The material is for information purposes only and does not contain, and should not be construed as containing, investment advice and/or investment recommendation and/or an investment research and/or an offer of or solicitation for any transactions in financial instruments; any decision to enter into a specific transaction shall be made by the client following an assessment by him/her of their situation.
StoneX Europe Ltd makes no representation or warranty and assumes no liability as to the accuracy or completeness of the information provided, nor any loss arising from any investment based on a recommendation, forecast or other information supplied. You should always seek independent advice as to your suitability to speculate in any related markets and your ability to assume the associated risks, if you are at all unsure. We are not under any obligation to update any such material. Any opinion made may be personal to the author and may not reflect the opinion of StoneX Europe Ltd.