




USD/JPY Probes Support as US Dollar Stumbles on Fed Cut Bets
USD/JPY tests key support as the US dollar weakens on rising Fed cut expectations and soft US data.
Share this:

USD/JPY is probing key support as a weaker US dollar and rising Fed cut expectations ripple across FX markets. Softer US data, dovish Fed commentary and improving risk appetite have pushed traders to reassess the December meeting and the timing of the next cut. With risk sentiment buoyant and the yen firming slightly, USD/JPY is at an important technical juncture.
View related analysis:
View related analysis:
USD/JPY Outlook: Key Levels Under Pressure as Dollar Softens
Expectations for a 25bp Fed cut in December have more than doubled over the past week to 82.7%, according to Fed funds futures. Several Fed members have turned notably dovish ahead of the blackout period for the December meeting, helped along by renewed pressure from President Trump for the central bank to ease. But the data is also making the case for a cut.
- ADP employment contracted by 13.5k, marking its third negative print.
- Inflation pressures softened, with core producer prices slowing to 2.6% y/y (2.7% forecast) and 0.1% m/m (0.2% expected).
- Consumer confidence fell to a seven-month low of 88.7, well below 95.5 prior and missing the 93.55 expected.
- Core retail sales rose just 0.1% m/m, missing the 0.4% forecast and below the revised 0.6% prior (down from 0.7%).


Bad news is good for Wall Street, with Dow Jones futures leading the S&P 500 and Nasdaq 100 higher for a third day. It seems traders are satisfied that the US economy is slowing fast enough to justify slower cuts, without slowing fast enough to trigger concerns of a recession.
AUD/USD rose for a third day ahead of today’s inflation release — the first monthly data available for Q4, with the official quarterly figures not due until late January. Traders will be watching trimmed mean inflation and CPI excluding travel and volatile items. With the US dollar on the back foot, the Australian dollar could extend its run to a fourth day unless CPI delivers a surprise downside miss — which seems unlikely at this stage.
US Dollar Index Pullback: Is Wave C Nearing Completion?
The US Dollar Index fell to a four-day low during its worst session in 13 days, sliding comfortably back below 100 as part of a countertrend move. If incoming US data continues to soften, the dollar could bring forward expectations of another 25bp cut — currently priced for April with a 40.9% probability.
Still, the daily trend structure on the US Dollar Index remains firm, so I’m open to wave c terminating around 101 or even 102 before any larger bearish move unfolds.
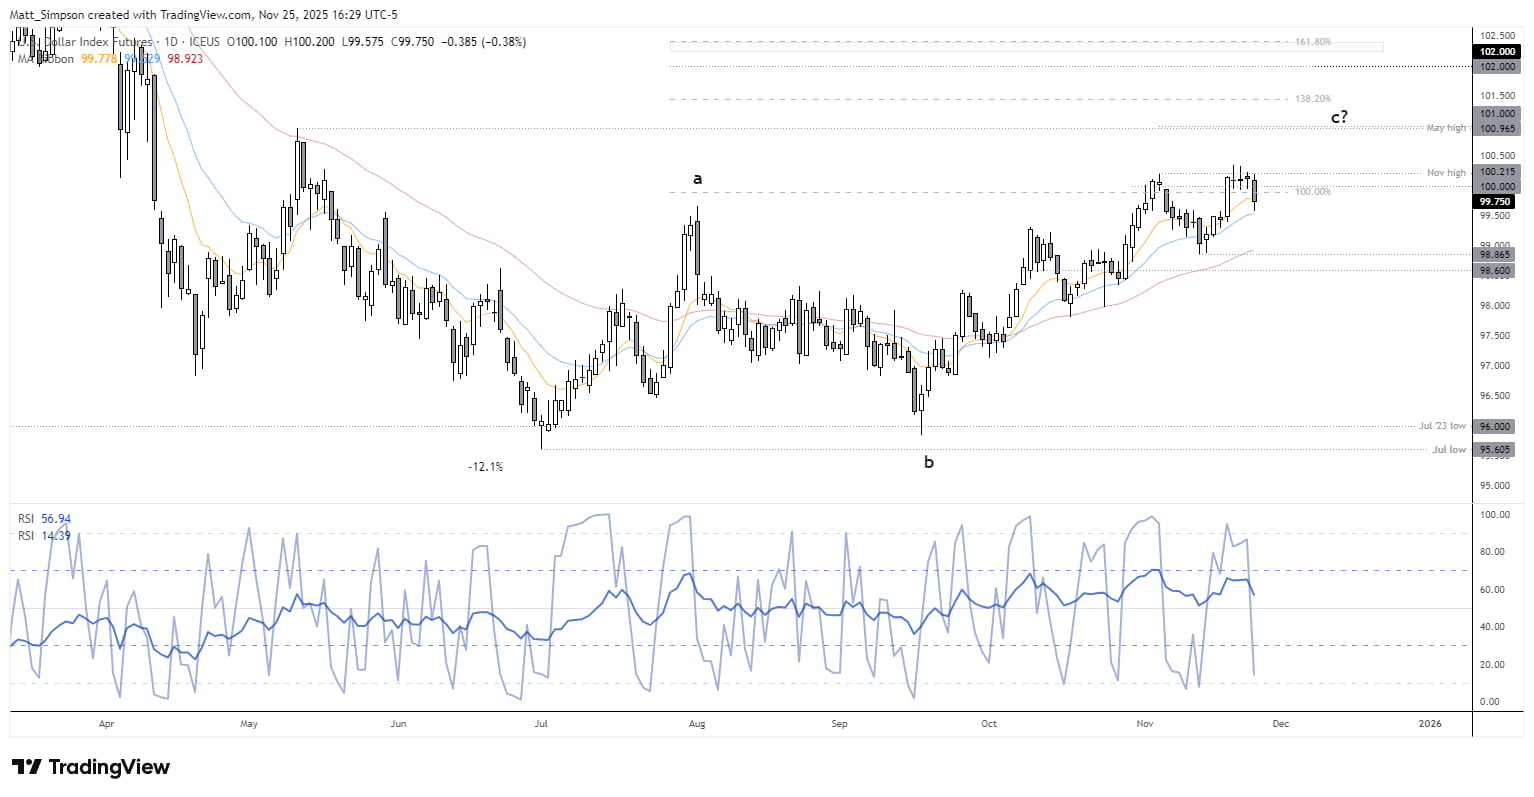
Chart analysis by Matt Simpson - data source: TradingView U.S. Dollar Index Futures
USD/JPY Technical Analysis:
The Japanese yen was slightly higher across the board, with the weaker US dollar helping USD/JPY slip to a four-day low. Support has held around the February high (155.89) and the 10-day EMA (155.85), which is likely to be a pivotal zone in the near term.
The broader daily trend remains firmly bullish, so traders need to assess whether this is simply a shallow pullback within a strong uptrend or the start of something larger.
Notably, the 1-week and 1-month USD/JPY risk reversals have not broken to new cycle highs alongside spot prices. This points to some caution from bulls, while implied volatility across the 1-week, 1-month and 3-month tenors remains low — signalling no sense of panic in this pullback.

Chart analysis by Matt Simpson - data source: LSEG
USD/JPY Short-Term Levels: Bounce Risk Before a Deeper Pullback
The 1-hour chart shows a bullish engulfing candle forming around the February high and the 10-day EMA, alongside a bullish divergence on the RSI (2) in the oversold zone. Traders may get a cheeky bounce from current levels before another leg lower.
Volumes were rising during the decline, the daily RSI (2) is not yet oversold, and the daily RSI (14) may have recently topped out — all pointing to the potential for a deeper pullback once the 1-hour bounce is done. Note support around 155, which includes a weekly VPOC at 155.20 for bears to target. A break beneath the 154.80 low implies a deeper pullback and brings the 152 handle into focus.

Chart analysis by Matt Simpson - data source: TradingView USD/JPY


Key Economic Events for Traders (AEDT / GMT+11)
Wednesday, November 26, 2025
10:50 JPY Corporate Services Price Index (USD/JPY, EUR/JPY, AUD/JPY)
11:30 AUD Construction Work Done; CPI; CPI Index Number; Trimmed Mean CPI; Weighted Mean CPI (AUD/USD, AUD/JPY, AUD/NZD, ASX 200)
12:00 NZD RBNZ Interest Rate Decision; RBNZ Monetary Policy Statement; RBNZ Rate Statement (NZD/USD, AUD/NZD, NZD/JPY)
13:00 NZD RBNZ Press Conference (NZD/USD, AUD/NZD, NZD/JPY)
16:00 JPY BoJ Core CPI; Coincident Indicator; Leading Index (USD/JPY, EUR/JPY, AUD/JPY)
20:00 CHF ZEW Expectations (USD/CHF, EUR/CHF)
20:00 EUR ECB Financial Stability Review (EUR/USD, EUR/GBP, DAX)
20:20 EUR German Buba Mauderer Speaks (EUR/USD, EUR/GBP, DAX)
21:00 GBP Autumn Forecast Statement (GBP/USD, EUR/GBP, FTSE 100)
21:30 EUR German 10-Year Bund Auction (EUR/USD, EUR/GBP, DAX)
23:00 USD MBA 30-Year Mortgage Rate; MBA Mortgage Applications; MBA Purchase Index; Mortgage Market Index; Mortgage Refinance Index (S&P 500, Nasdaq 100, USD/JPY)
Thursday, November 27, 2025
All Day Holiday: United States – Thanksgiving Day
00:30 USD Building Permits; Continuing Jobless Claims; Core Durable Goods Orders; Core PCE Prices; GDP; GDP Price Index; Jobless Claims (S&P 500, Nasdaq 100, USD/JPY, USD/CAD)
02:00 USD Core PCE Price Index; New Home Sales; PCE Price Index; Personal Income; Personal Spending
(S&P 500, Nasdaq 100, USD/JPY, USD/CAD)
View the full economic calendar
View the full economic calendar
-- Written by Matt Simpson
Follow Matt on Twitter @cLeverEdge
How to trade with City Index
You can trade with City Index by following these four easy steps:
- Open an account, or log in if you’re already a customer
• Open an account in the UK
• Open an account in Australia
• Open an account in Singapore
- Search for the market you want to trade in our award-winning platform
- Choose your position and size, and your stop and limit levels
- Place the trade
Related tags:
Latest market news




The complete CFD trading experience
Award-winning platforms, competitive spreads, low commissions and dedicated support.
We live and breathe the markets and are dedicated to helping traders realise their ambitions as we continue to set the industry bar.
Economic calendar
Web Trader platform
Our sophisticated web-based platform is packed with features.
Related articles
Swiss Franc Forecast: USD/CHF Seven-Week Rally Reverses From Yearly Highs 10 16 2026
A sharp rejection from fresh highs has shifted momentum in favor of USD/CHF bears, raising the stakes for a critical support test.

Nasdaq 100 forecast: Tech stocks not out of woods yet
US index futures pushed higher in the first half of Friday’s session, taking cues from a strong performance from European equities. Both European and US equity futures extending yesterday’s impressive recovery after the sharp sell-off earlier in the week. But the lingering concerns around the AI investment cycle remain, while bond markets were easing lower again, lifting yields.


ASX 200 Outlook: A Rates Trade Disguised as a Stock Market?
Australian bond futures have exhibited a far stronger relationship with the ASX 200 than Wall Street over recent months. Now both markets are displaying remarkably similar price structures.

StoneX Europe Ltd may make third party material available on this website which may contain information included but not limited to the conditions of financial markets. The material is for information purposes only and does not contain, and should not be construed as containing, investment advice and/or investment recommendation and/or an investment research and/or an offer of or solicitation for any transactions in financial instruments; any decision to enter into a specific transaction shall be made by the client following an assessment by him/her of their situation.
StoneX Europe Ltd makes no representation or warranty and assumes no liability as to the accuracy or completeness of the information provided, nor any loss arising from any investment based on a recommendation, forecast or other information supplied. You should always seek independent advice as to your suitability to speculate in any related markets and your ability to assume the associated risks, if you are at all unsure. We are not under any obligation to update any such material. Any opinion made may be personal to the author and may not reflect the opinion of StoneX Europe Ltd.