



Thanksgiving Market Seasonality: US Dollar, EUR/USD and Gold
How the US Dollar, EUR/USD and Gold typically behave around Thanksgiving, based on seasonality patterns back to 1985.
Share this:

Seasonality analysis often focuses on longer-term annual trends, but shorter patterns also emerge around major events and holidays. A well-known example is the equity “Santa rally” in late December. Here, we examine market performance around the US Thanksgiving holiday to identify recurring tendencies across the four-day weekend.
View related analysis:
View related analysis:
Thanksgiving Seasonality: USD, EUR/USD and Gold
US Dollar Index (DXY) Technical Analysis
A clear pattern emerges for the US dollar heading into Thanksgiving, with the Dollar Index posting negative average returns on the Monday, Tuesday and Wednesday before the holiday. Each of these days has a win rate below 50%, with Tuesday closing lower 59.4% of the time based on data going back to 1985.
Wednesday — the eve of Thanksgiving — records the widest average and median daily range at 0.74%, indicating consistent volatility rather than a result skewed by outliers.
Volatility is lowest on Thanksgiving Day itself as US futures markets are closed, before expanding again as traders return and refocus on broader macro factors. Median and average ranges track closely, reinforcing reliability of the data.
While both Thanksgiving Day and the following Monday (TG+2) show small positive average returns, the median is flat on TG but stronger on Monday. The broader theme, however, remains a softer US dollar heading into the long weekend.

Chart analysis by Matt Simpson - data source: ICE, LSEG


EUR/USD EUR/USD Technical Analysis: Euro vs US Dollar
Tuesday (TG-2) delivers the best average return at 0.05% ahead of Thanksgiving, with a higher median at 0.08%. Its 66.7% win rate highlights a clear bullish bias for EUR/USD on this day.
The strongest performance arrives the Tuesday after Thanksgiving, averaging 0.12% with a median of 0.20%. The 57% win rate is likely influenced by the normalisation of liquidity as traders return from the holiday. This Tuesday also has the second-narrowest daily range, averaging 0.71% with a median of 0.64%.
Wednesday (TG-1) produces the widest average daily range at 0.91% and a median of 0.80%, suggesting stable and reliable volatility.
As expected, Thanksgiving Day (Thursday) has the narrowest range and the lowest win rate, closing lower 57.6% of the time.

Chart analysis by Matt Simpson - data source: LSEG


Gold Futures (GC) Technical Analysis
The two Mondays either side of Thanksgiving tend to be bearish for gold, with negative average and median returns, higher volatility and the weakest win rates.
The strongest seasonal bias typically emerges on the Tuesday before Thanksgiving and the Friday after, posting win rates of 58.9% and 61.5% respectively.
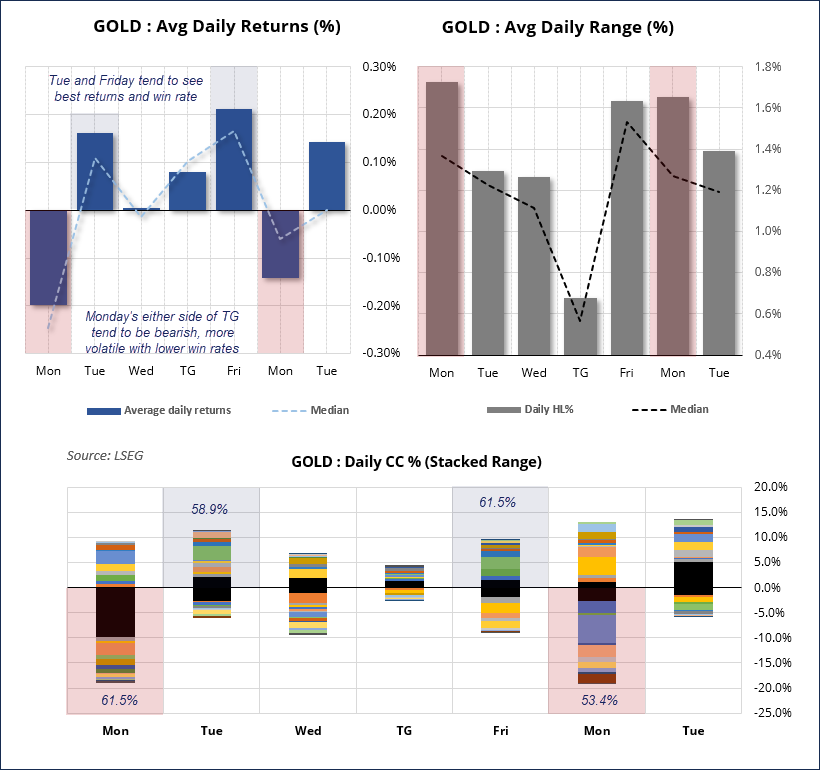
Chart analysis by Matt Simpson - data source: LSEG, COMEX
View the full economic calendar
View the full economic calendar
-- Written by Matt Simpson
Follow Matt on Twitter @cLeverEdge
How to trade with City Index
You can trade with City Index by following these four easy steps:
- Open an account, or log in if you’re already a customer
• Open an account in the UK
• Open an account in Australia
• Open an account in Singapore
- Search for the market you want to trade in our award-winning platform
- Choose your position and size, and your stop and limit levels
- Place the trade
Related tags:

The complete CFD trading experience
Award-winning platforms, competitive spreads, low commissions and dedicated support.
We live and breathe the markets and are dedicated to helping traders realise their ambitions as we continue to set the industry bar.
Economic calendar
Web Trader platform
Our sophisticated web-based platform is packed with features.
Related articles

USD/JPY weekly outlook: Quarter turn scrambles rates regime
USD/JPY’s tight relationship with front-end US rates broke down sharply last week, but quarter-turn flows and positioning suggest the disconnect may prove temporary.


Gold Update: XAU/USD Remains Under Pressure Even After the NFP Report
As the trading week comes to an end, weakness around gold price action remains evident in the short term. This can be seen in the performance of the past two sessions, where the metal has declined by approximately 0.3%. Although the move has not been particularly aggressive, it highlights that buying pressure continues to struggle to regain control of the market.

USD/CAD forecast: rally could accelerate above June highs at 1.4250
USD/CAD recovered quickly after weaker US jobs data, keeping the bullish trend in focus. A move above the June highs could accelerate the rally as inflation keeps the Fed under pressure.

StoneX Europe Ltd may make third party material available on this website which may contain information included but not limited to the conditions of financial markets. The material is for information purposes only and does not contain, and should not be construed as containing, investment advice and/or investment recommendation and/or an investment research and/or an offer of or solicitation for any transactions in financial instruments; any decision to enter into a specific transaction shall be made by the client following an assessment by him/her of their situation.
StoneX Europe Ltd makes no representation or warranty and assumes no liability as to the accuracy or completeness of the information provided, nor any loss arising from any investment based on a recommendation, forecast or other information supplied. You should always seek independent advice as to your suitability to speculate in any related markets and your ability to assume the associated risks, if you are at all unsure. We are not under any obligation to update any such material. Any opinion made may be personal to the author and may not reflect the opinion of StoneX Europe Ltd.