



ASX 200 Morning Market Outlook: ASX Snaps 5-Month Winning Streak
ASX 200 set to end its five-month winning streak as sector weakness and global underperformance weigh. Traders eye near-term signals for direction.
Share this:

The ASX 200 looks set to snap a five-month winning streak — its longest since August 2021. While that episode led to a 16% correction over the following year, this time the setup is more nuanced. The index has lagged global peers such as the S&P 500 and Dow Jones over the past 60 sessions, and end-of-month flows have produced a shooting star candle to warn of near-term weakness. Yet, strong dip-buying interest suggests bulls remain active, with traders now weighing whether consolidation will resolve in a breakout or deeper retracement.
ASX 200 Market Snapshot: Weakness Emerges After Five-Month Rally
- The ASX 200 is on track to snap a five-month winning streak, its longest since August 2021.
- Back then, the index went on to suffer a 16% correction over the following year — whether history repeats or merely rhymes remains to be seen.
- Over the past 60 trading days, the ASX 200 has clearly underperformed global peers such as the Dow Jones and S&P 500.
- End-of-month flows left the ASX 200 cash index with a shooting star candle, signalling potential near-term weakness.
- Nine of eleven sectors declined on Monday, led by Energy and Telecoms, while Materials and Industrials were the only gainers.

Charts prepared by Matt Simpson - data source: ASX, LSEG
View related analysis:
View related analysis:
ASX 200 Technical Analysis
The daily chart shows the ASX 200 trading in a sideways range between ~8750 and 8900 over the past month. Initially, I considered this consolidation to be a choppy wave ‘b’ that required a leg ‘c’ lower. However, the index has held up well, suggesting buyers are willing to step in on dips in anticipation of a bullish breakout. I am now leaning toward the latter scenario.
Monday’s rally into resistance was impressive, and I suspect bulls view the current, albeit shallow, pullback as simply that — a pause within a move that wants to push higher.
On the 4-hour chart, the ASX is holding around a high-volume node (HVN) and trades just above the weekly pivot point (8832). Unless risk appetite turns sharply lower, I am inclined to seek evidence of a swing low, with the expectation of at least a retest of the range highs — and potentially a breakout for pre-emptive bulls.
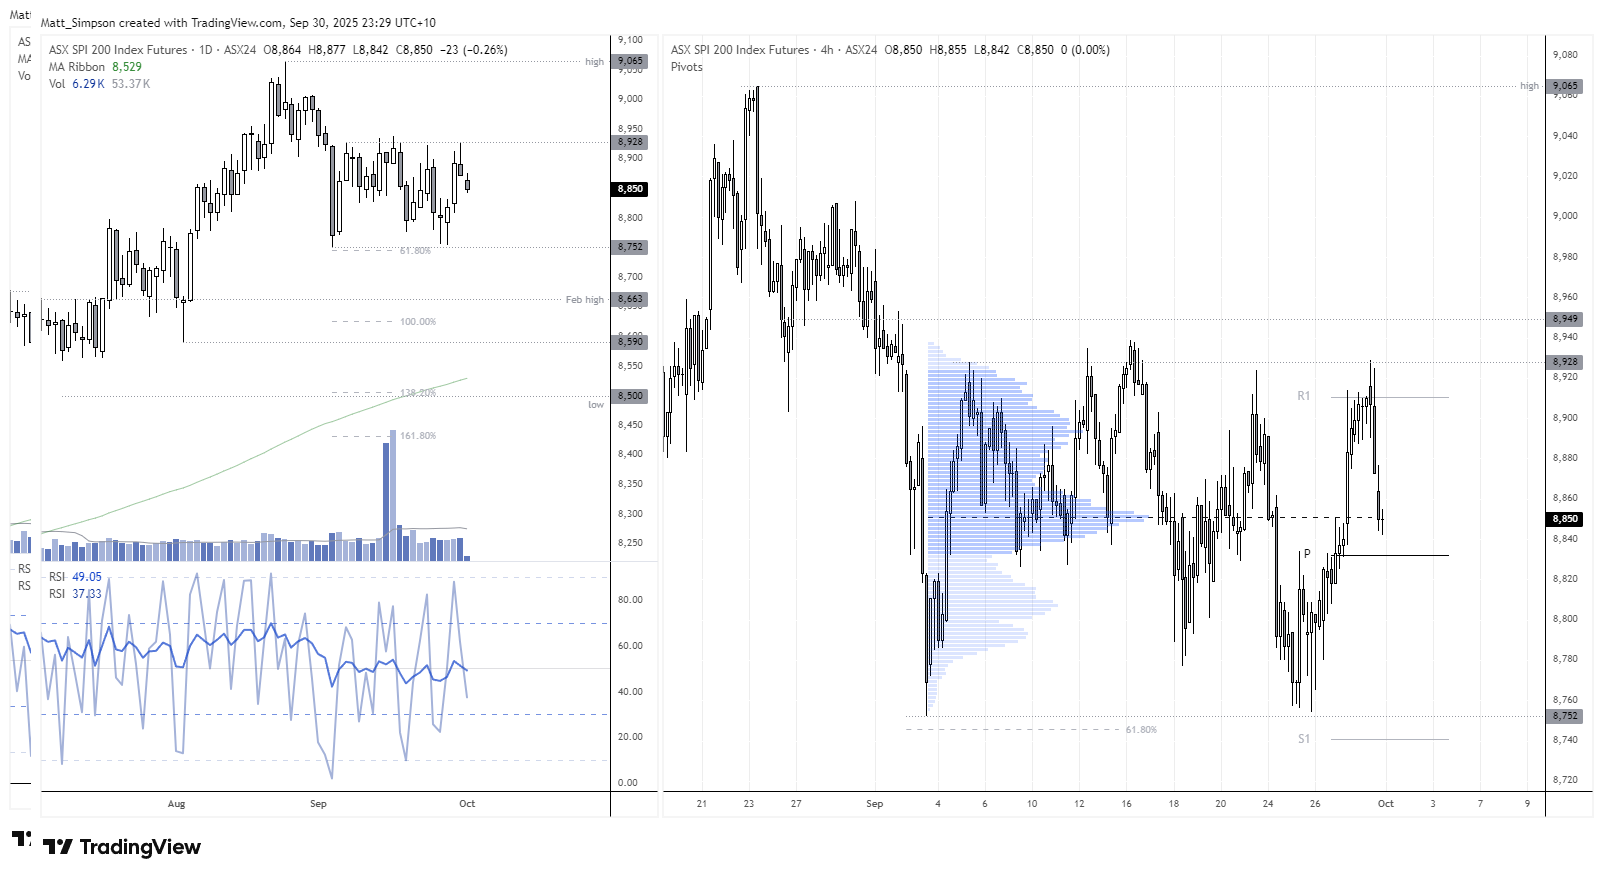
Chart analysis by Matt Simpson - Source: TradingView, ASX SPI 200 Index Futures


Global Index Futures and Asian Market Moves
Asian Indices:
- ASX 200: Fell by -14 points (-0.16%) and currently trades at 8,848.80
- Nikkei 225: Rose by 121.28 points (0.33%) and currently trades at 36,668.23
- Hang Seng: Rose by 232.68 points (0.87%) and currently trades at 26,855.56
- China A50: Fell by -46.7 points (-0.31%) and currently trades at 15,142.31
US index futures:
- Dow Jones Futures: Down -66 points (-0.14%)
- S&P 500 Futures: Down -8.75 points (-0.13%)
- Nasdaq 100 Futures: Down -20.5 points (-0.08%)
View the full economic calendar
View the full economic calendar
-- Written by Matt Simpson
Follow Matt on Twitter @cLeverEdge
How to trade with City Index
You can trade with City Index by following these four easy steps:
- Open an account, or log in if you’re already a customer
• Open an account in the UK
• Open an account in Australia
• Open an account in Singapore
- Search for the market you want to trade in our award-winning platform
- Choose your position and size, and your stop and limit levels
- Place the trade
Related tags:
Latest market news




The complete CFD trading experience
Award-winning platforms, competitive spreads, low commissions and dedicated support.
We live and breathe the markets and are dedicated to helping traders realise their ambitions as we continue to set the industry bar.
Economic calendar
Web Trader platform
Our sophisticated web-based platform is packed with features.
Related articles

ASX 200 Outlook: A Rates Trade Disguised as a Stock Market?
Australian bond futures have exhibited a far stronger relationship with the ASX 200 than Wall Street over recent months. Now both markets are displaying remarkably similar price structures.


RBA delivers 25bp hike, Bullock now the main event
The RBA delivered the expected 25bp hike, but Bullock’s press conference now looms as the bigger volatility risk for AUD/USD and the ASX 200.

ASX 200 Futures Reversal Patterns Put to the Test
Not all reversal patterns are created equal. Historical ASX 200 futures data shows which signals have been more reliable, and why risk management still matters.
StoneX Europe Ltd may make third party material available on this website which may contain information included but not limited to the conditions of financial markets. The material is for information purposes only and does not contain, and should not be construed as containing, investment advice and/or investment recommendation and/or an investment research and/or an offer of or solicitation for any transactions in financial instruments; any decision to enter into a specific transaction shall be made by the client following an assessment by him/her of their situation.
StoneX Europe Ltd makes no representation or warranty and assumes no liability as to the accuracy or completeness of the information provided, nor any loss arising from any investment based on a recommendation, forecast or other information supplied. You should always seek independent advice as to your suitability to speculate in any related markets and your ability to assume the associated risks, if you are at all unsure. We are not under any obligation to update any such material. Any opinion made may be personal to the author and may not reflect the opinion of StoneX Europe Ltd.