



ASX 200 Morning Outlook: Buyers Test Support as BHP and WOW Stabilise
ASX 200 steadies after two days of losses as BHP and Woolworths find support, hinting that buyers may be testing the waters.
Share this:

The ASX 200 extended its losing streak to a second day but showed early signs of stabilisation, outperforming its APAC peers after the Nikkei 225 plunged as much as 3%. Technical signals point to a potential rebound, with BHP and Woolworths finding support and showing signs of renewed buyer interest.
View related analysis:
- Nasdaq 100 Outlook: Tech Bulls Rattled as Wall Street Selloff Deepens
- ASX 200 Morning Market Outlook: Sectors Highlight Structural Weakness
- ASX 200 Morning Market Outlook: Westpac (WBC) Leads Big 4 Lower Post-CPI
- ASX 200 Morning Outlook: Real Estate Reeling Post RBA (GMG, GPT, SCG)
- ASX 200 Morning Market Outlook: Bearish Reversal Pattern For October
ASX 200 Outlook: Buyers Step In as Sentiment Stabilises
ASX 200 Market Snapshot
- The ASX 200 closed lower for a second consecutive day but outperformed its APAC peers, including the Nikkei 225, which fell as much as 3% on Wednesday.
- Seven of the eleven ASX sectors declined, led by Information Technology (XIJ) and Materials (XMJ).
- A bullish hammer formed at the September low, while daily trading volume rose to a four-day high, suggesting a potential shift in momentum from bears to bulls.
- Thursday has historically been the most volatile day of the week for the ASX 200, with an average daily range of 78.8 points over the past year — though this has eased to 73.2 points over the past three months.
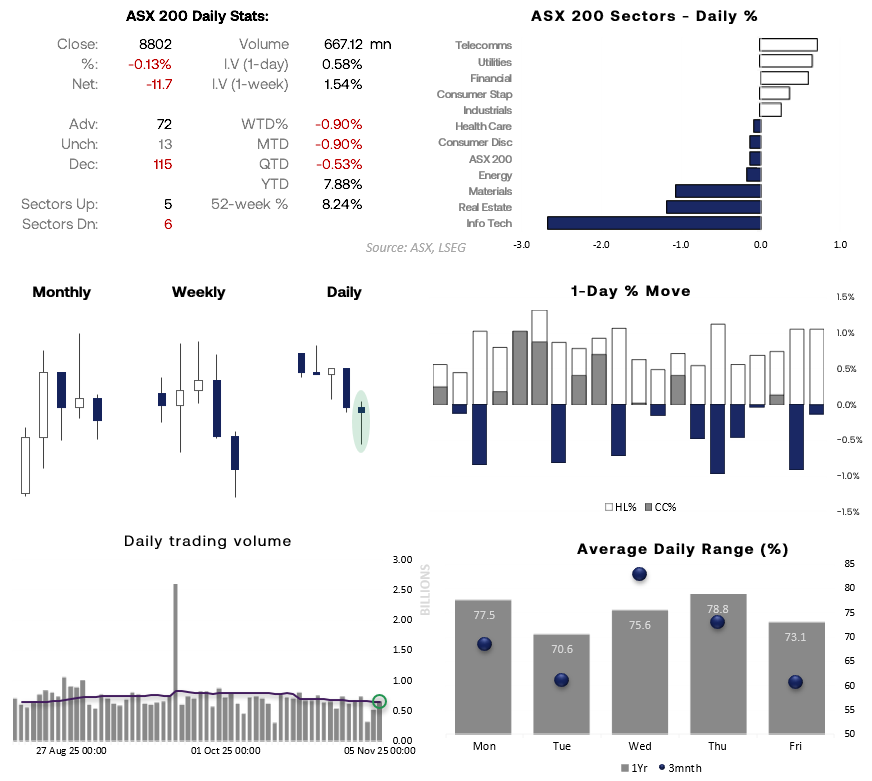
Chart analysis by Matt Simpson - source: ASX, LSEG


BHP Group (BHP) Technical Analysis
While the BHP share price has risen 36% from its April low to October high, it has entered a pullback after meeting resistance around the September 2024 high. The depth of the retracement remains unclear, although it’s worth noting that BHP posted three consecutive bearish weeks during its previous correction in August.
If BHP closes the week around current levels, it will have completed a three-bar bearish reversal (evening star pattern), with the second candle forming a shooting star. That said, recent price action on the daily chart suggests near-term support has emerged, hinting at the potential for at least a short-term bounce.
Wednesday’s bullish gravestone doji closed back above the 50-day EMA and the weekly pivot point. Its low perfectly respected the October VPOC, with the September VPOC nearby. The daily RSI (2) also shows its most oversold reading since August.
Bulls could look to buy dips within Wednesday’s range and maintain a near-term bullish bias while prices hold above the September VPOC (41.72). An open target may be suitable in anticipation of a possible bullish catalyst.
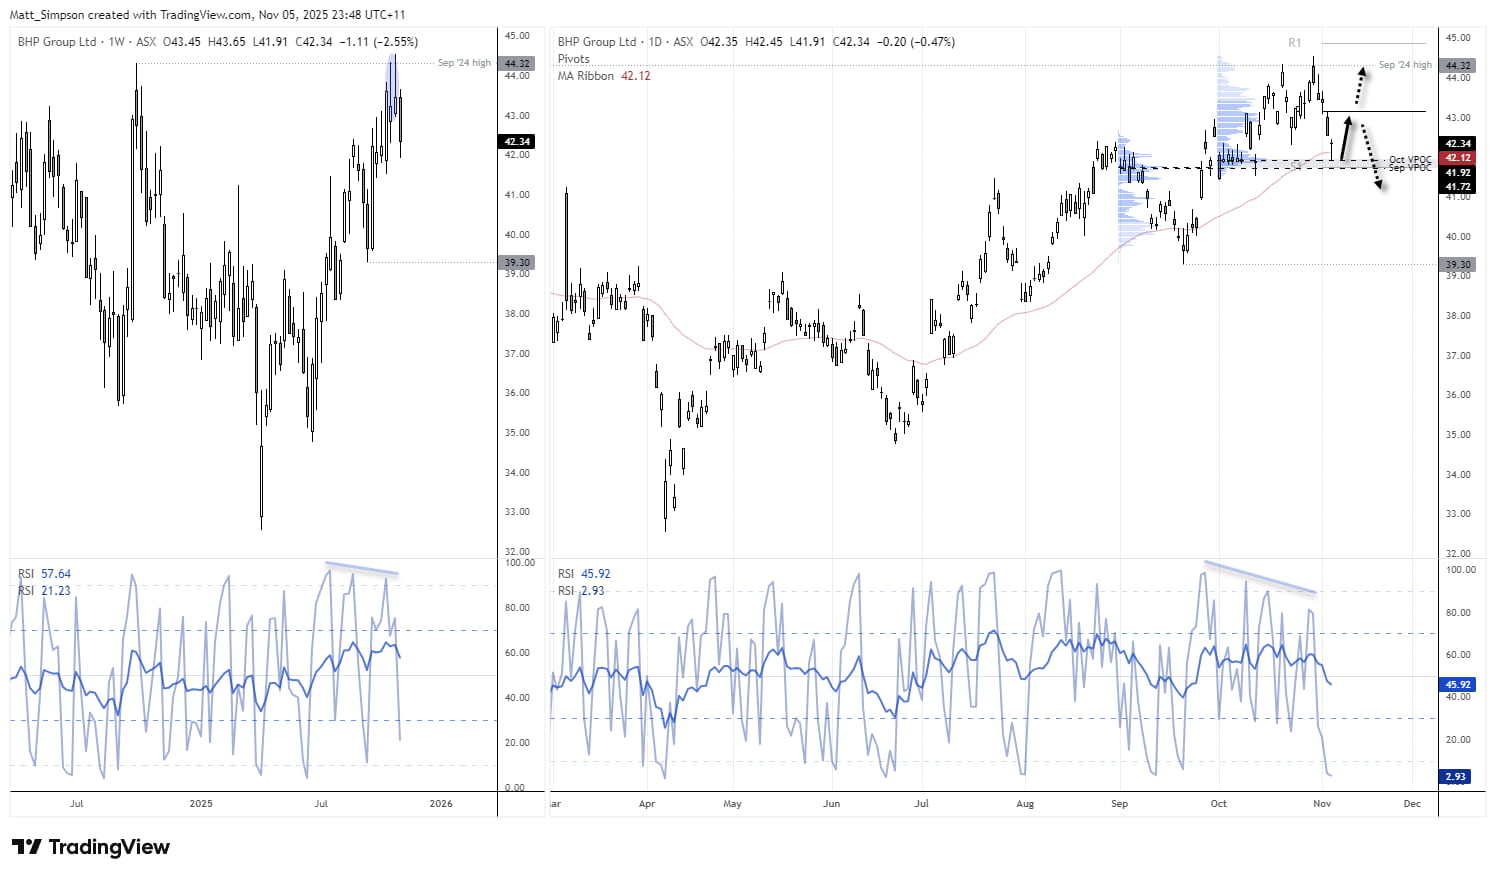
Chart analysis by Matt Simpson - source: ASX, TradingView
Woolworths (WOW) Technical Analysis
Last week, Woolworths (WOW) posted a solid two-day rally exceeding 8%, aligning with my prior bullish bias. The gap above the 50-day EMA during that surge highlights a strong burst of buying enthusiasm.
Prices are now retracing gently lower, and with the gap, 50-day EMA (27.71), and monthly pivot point (27.50) clustered nearby, these levels could offer potential support. Bulls may be waiting to reload, targeting the monthly R1 (29.50) or gap resistance near the $30 handle.
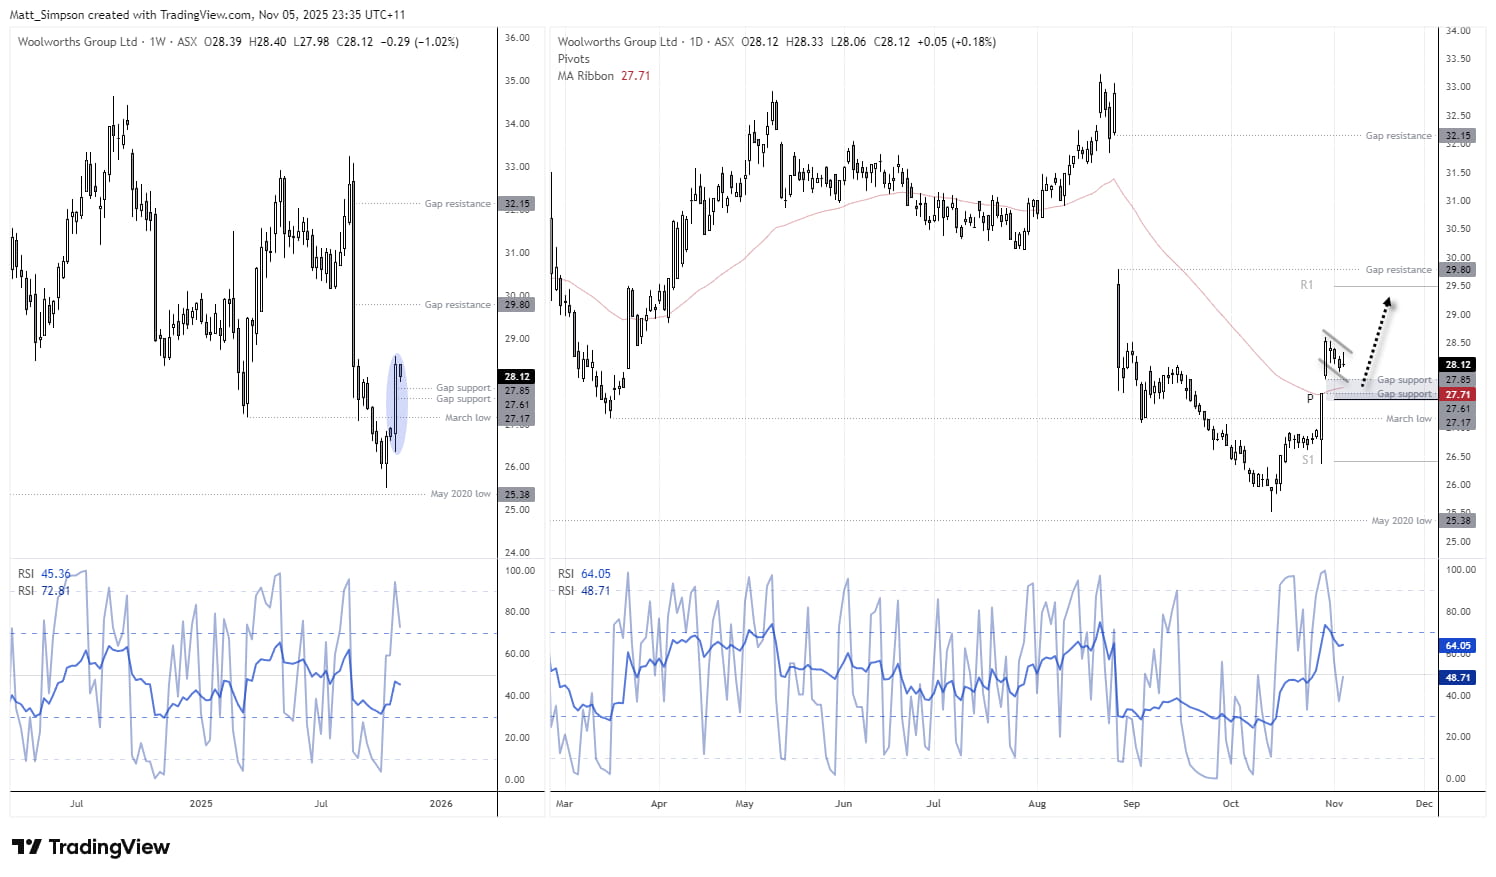
Chart analysis by Matt Simpson - source: ASX, TradingView
ASX 200 Watchlist Update
Goodman Group (GMG) broke beneath its September low in line with my bearish bias. The ASX Real Estate (XRE) sector has remained under pressure since the RBA’s dovish hold on Tuesday, with the index now trading below 4000 — marking a four-month low.
GPT Group (GPT) gapped lower beneath the September low but reversed its losses and fully closed the gap by the session’s end, signalling the potential for a false move. It’s touch-and-go from here as to whether that was a bear trap or the early stages of a renewed bearish leg.
Commonwealth Bank (CBA) reached my upside target at the August high, though the spinning top doji and choppy price action suggest the rally is losing momentum. Still, if prices can hold above the 169.16 low, a push towards 180 remains on the cards.


ASX 200, SPI 200 Futures Technical Analysis
The daily cash chart of the ASX 200 shows that Wednesday’s bullish hammer formed around the September low and closed back above the 100-day EMA after briefly breaking beneath it intraday. A small bullish RSI (2) divergence has also appeared within the oversold zone, hinting at possible short-term upside momentum.
On the ASX 200 futures chart (SPI 200) to the right, a spinning top doji has developed near the 100-day EMA and 8756 low. The overnight rebound in Wall Street futures lifted SPI 200 futures alongside it. My near-term bias remains bullish, with buyers likely to seek dips towards the 100-day EMA or 8800 handle, targeting 8950, 9000, and the 9093 HVN as potential upside objectives.

Chart analysis by Matt Simpson - Source: TradingView, ASX SPI 200 Index Futures, S&P/ASX 200 Index
View the full economic calendar
View the full economic calendar
-- Written by Matt Simpson
Follow Matt on Twitter @cLeverEdge
How to trade with City Index
You can trade with City Index by following these four easy steps:
- Open an account, or log in if you’re already a customer
• Open an account in the UK
• Open an account in Australia
• Open an account in Singapore
- Search for the market you want to trade in our award-winning platform
- Choose your position and size, and your stop and limit levels
- Place the trade
Latest market news




The complete CFD trading experience
Award-winning platforms, competitive spreads, low commissions and dedicated support.
We live and breathe the markets and are dedicated to helping traders realise their ambitions as we continue to set the industry bar.
Economic calendar
Web Trader platform
Our sophisticated web-based platform is packed with features.
Related articles

S&P 500 forecast: AI linked stocks remain under pressure
And just like that, it is Friday again and the end of a volatile week. Today offers little on the macro calendar to change the prevailing narrative, leaving markets largely at the mercy of risk appetite, oil prices and the growing unease around the AI trade.


USD/JPY, Nikkei Break Lower as AI Meltdown Spreads
Thursday’s tech tantrum has become Friday’s fire sale. With Nikkei support giving way and the yen strengthening, could the selling start feeding on itself?

Nasdaq, Treasury yields and dollar face a major AI sentiment test
From crude to AI, the forces driving US markets have changed dramatically. Thursday's Nasdaq rout triggered an extraordinary Treasury rally, but the dollar barely moved. What happens next could depend on Nasdaq support.
StoneX Europe Ltd may make third party material available on this website which may contain information included but not limited to the conditions of financial markets. The material is for information purposes only and does not contain, and should not be construed as containing, investment advice and/or investment recommendation and/or an investment research and/or an offer of or solicitation for any transactions in financial instruments; any decision to enter into a specific transaction shall be made by the client following an assessment by him/her of their situation.
StoneX Europe Ltd makes no representation or warranty and assumes no liability as to the accuracy or completeness of the information provided, nor any loss arising from any investment based on a recommendation, forecast or other information supplied. You should always seek independent advice as to your suitability to speculate in any related markets and your ability to assume the associated risks, if you are at all unsure. We are not under any obligation to update any such material. Any opinion made may be personal to the author and may not reflect the opinion of StoneX Europe Ltd.