


ASX 200 Outlook: A Bounce Is Brewing, But Data Risk Looms
The ASX 200 looks due a bounce from support, although inflation and employment data may determine whether bulls can challenge 8900.
Share this:

It looks like the ASX could be due a bounce, though whether it can simply storm to new cycle highs could lay in the hands of domestic data and global sentiment. Traders will keep a close eye on Wednesday’s inflation data and household spending and employment reports released on Thursday. Combined, these reports have greater potential to sway RBA monetary policy expectations than their recent meeting.
View related analysis:
View related analysis:
ASX 200 Outlook: A Bounce Is Brewing, But Data Risk Looms
ASX 200 Market Snapshot
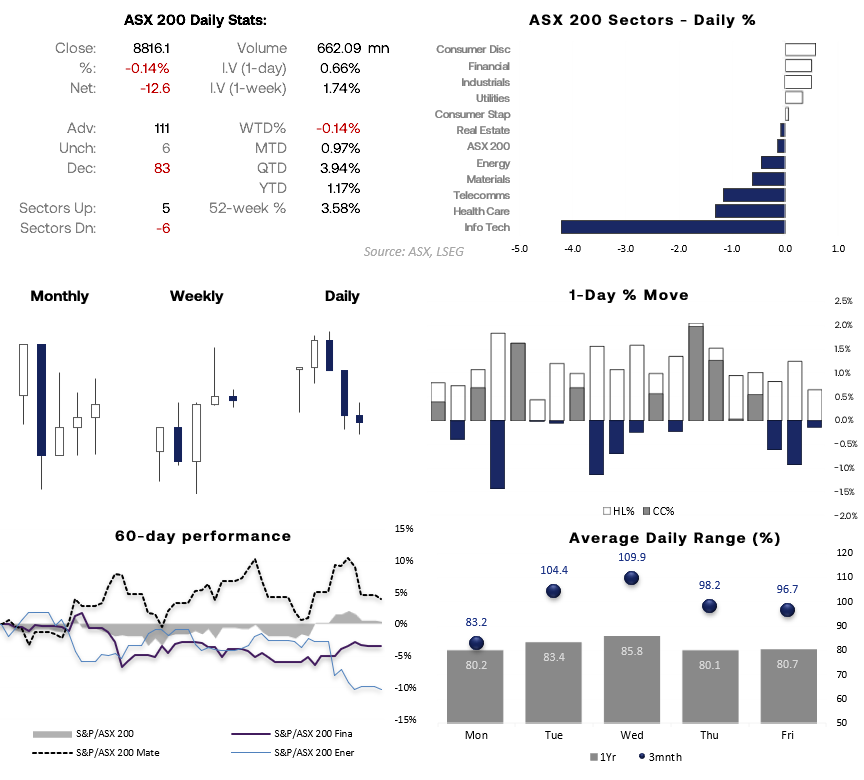
- The ASX fell for a third consecutive day on Monday, although its 0.6% trading range was the narrowest in nearly three weeks, suggesting bearish momentum is fading as prices test support.
- Six of the 11 sectors closed lower, led by XIJ Information Technology (-4.2%) and XHJ Health Care (-1.3%). XDJ Consumer Discretionary (+0.6%) and XFJ Financials (+0.5%) led the four sectors that finished higher.
- 111 stocks advanced, 83 declined and 6 were unchanged.
- Volatility tends to pick up over the next couple of sessions based on daily averages. Tuesday's average range has been 104.4 points over the past three months, rising to 109.9 points on Wednesday.
Source: ASX, LSEG
ASX 200 Correlations Highlight Financials and Materials as Market Leaders
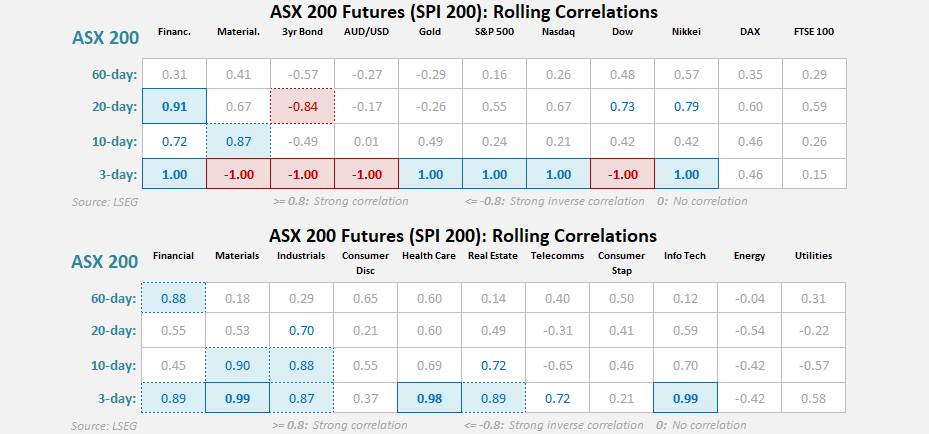
Financials and Materials remain the key sectors to watch, with both maintaining strong positive correlations with the ASX 200 over the past 10 and 20 trading days. Materials have been particularly influential recently, posting a near-perfect 0.99 correlation over the past three sessions, while Financials remain highly correlated across all timeframes. Industrials, Health Care and Real Estate have also shown strong short-term relationships with the index, suggesting gains have been relatively broad-based rather than concentrated in a single sector.


Globally, the ASX 200 continues to take its lead from Wall Street. Correlations with the Nasdaq (0.79), Dow Jones (0.73) and S&P 500 (0.55) remain firm over the past 20 days, while the Nikkei's correlation has risen to 0.79. Bond yields continue to exert a strong inverse influence, with the 3-year bond future holding a -0.84 correlation over 20 days. Short-term correlations have become distorted by the small sample size of the three-day measure, but overall the data suggest traders should continue monitoring Financials, Materials and US equity indices for the strongest directional cues.
Source: ASX, LSEG
ASX 200 Technical Analysis
Options Traders Focus on 8750 Support and 8900 Resistance
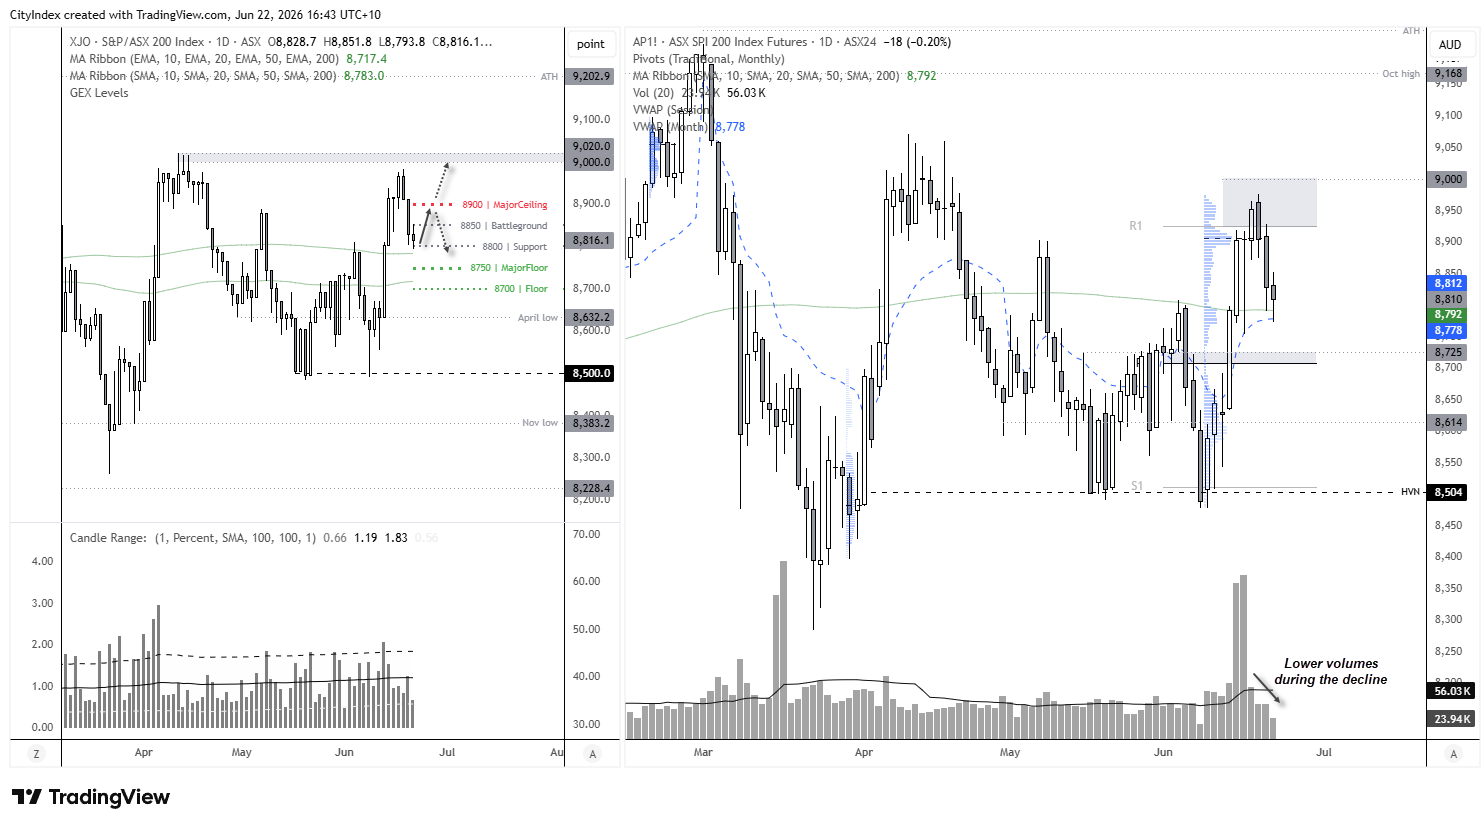
The ASX 200 remains caught between a major gamma floor at 8750 and a ceiling at 8900 ahead of Thursday's expiry. Heavy put open interest at 8750 aligns with the 200-day SMA and 200-day EMA, creating a notable area of support where bulls may be tempted to buy dips.
Meanwhile, 8900 is the first meaningful upside barrier where call open interest clearly outweighs puts, making it a potential target for bulls if sentiment improves ahead of Australian data on Wednesday and Thursday.
However, unless the index can accept above 8900 or below 8750, traders should be prepared for choppy, range-bound trade between support and resistance into expiry.
SPI 200 Reclaims 200-Day EMA as Pullback Loses Momentum
The daily SPI 200 futures chart shows that the regular trading-hours low found support at the monthly VWAP and has reclaimed its 200-day EMA. Large-volume candles accompanied the rally into the recent highs, while volumes have been lighter during the three-day pullback. That suggests the decline is more likely a correction within the broader advance than the beginning of a deeper bearish move.
Source: ASX, TradingView
View the full economic calendar
View the full economic calendar
-- Written by Matt Simpson
Follow Matt on Twitter @cLeverEdge
How to trade with City Index
You can trade with City Index by following these four easy steps:
- Open an account, or log in if you’re already a customer
• Open an account in the UK
• Open an account in Australia
• Open an account in Singapore
- Search for the market you want to trade in our award-winning platform
- Choose your position and size, and your stop and limit levels
- Place the trade
Related tags:


The complete CFD trading experience
Award-winning platforms, competitive spreads, low commissions and dedicated support.
We live and breathe the markets and are dedicated to helping traders realise their ambitions as we continue to set the industry bar.
Economic calendar
Web Trader platform
Our sophisticated web-based platform is packed with features.
Related articles
Forex & Gold Outlook: Dollar Dominates, Crosses Diverge
The US dollar rally gathers momentum as forex crosses develop contrasting technical setups. Matt Simpson examines eight FX markets and gold for potential trading opportunities.

Gold Outlook: Asia Buys the Dip, US Hammers the Rip
Asia buys the dip, the US sells the rip. Hourly gold, dollar and Treasury yield data reveal a regional divide that has become especially pronounced since September.

US dollar forecast: USD/JPY and USD/CHF in focus | Forex Friday
Sticky US inflation and a hawkish Fed have kept the dollar firm across the majors, with USD/JPY pressing on the 160 handle. Here are the levels that matter on USD/JPY and USD/CHF as next week's retail sales, Nvidia results and FOMC minutes approach.

StoneX Europe Ltd may make third party material available on this website which may contain information included but not limited to the conditions of financial markets. The material is for information purposes only and does not contain, and should not be construed as containing, investment advice and/or investment recommendation and/or an investment research and/or an offer of or solicitation for any transactions in financial instruments; any decision to enter into a specific transaction shall be made by the client following an assessment by him/her of their situation.
StoneX Europe Ltd makes no representation or warranty and assumes no liability as to the accuracy or completeness of the information provided, nor any loss arising from any investment based on a recommendation, forecast or other information supplied. You should always seek independent advice as to your suitability to speculate in any related markets and your ability to assume the associated risks, if you are at all unsure. We are not under any obligation to update any such material. Any opinion made may be personal to the author and may not reflect the opinion of StoneX Europe Ltd.