




ASX 200 Technical Outlook: Index Pulls Back as Bears Eye Support
ASX 200 snaps winning streak as bearish signals emerge. Watch key support near 8100 and 8045 after the index's sharpest rally since November 2020.
Share this:

ASX 200 (Australian 200 Index) at a Glance
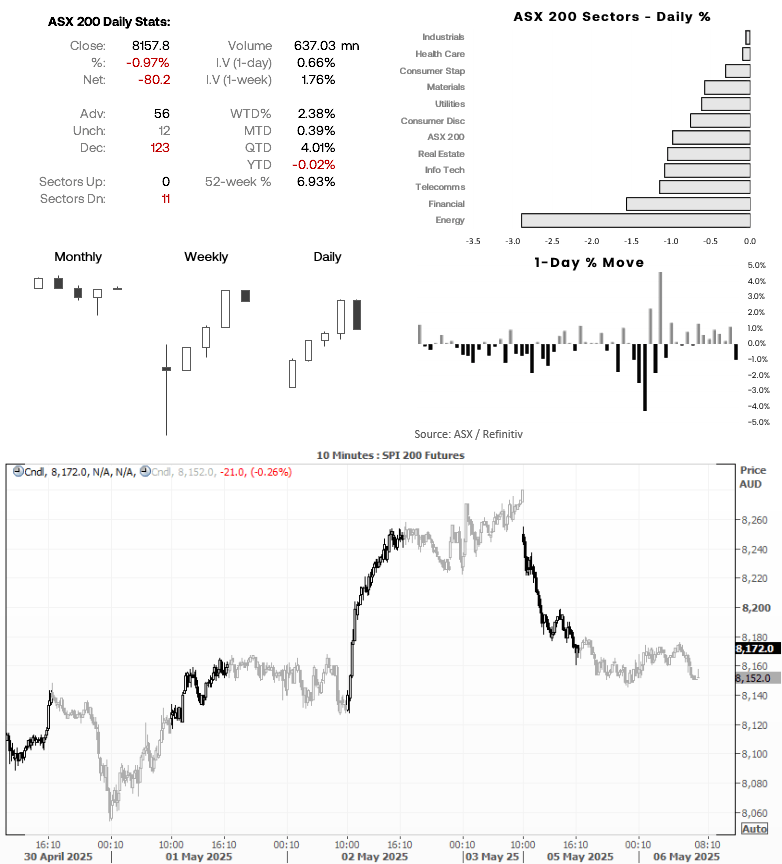
- The ASX 200 cash index snapped a 7-day winning streak on Monday, marking the end of its best run since September
- All 11 ASX 200 sectors closed lower, led by energy and financials
- 123 ASX 200 stocks declined, 56 advanced, 2 were flat
- ASX 200 futures (SPI 200) were -21 points lower overnight, indicating a weak open for the ASX cash market today
ASX 200 Index Futures (Australian 200 Index) Technical Analysis
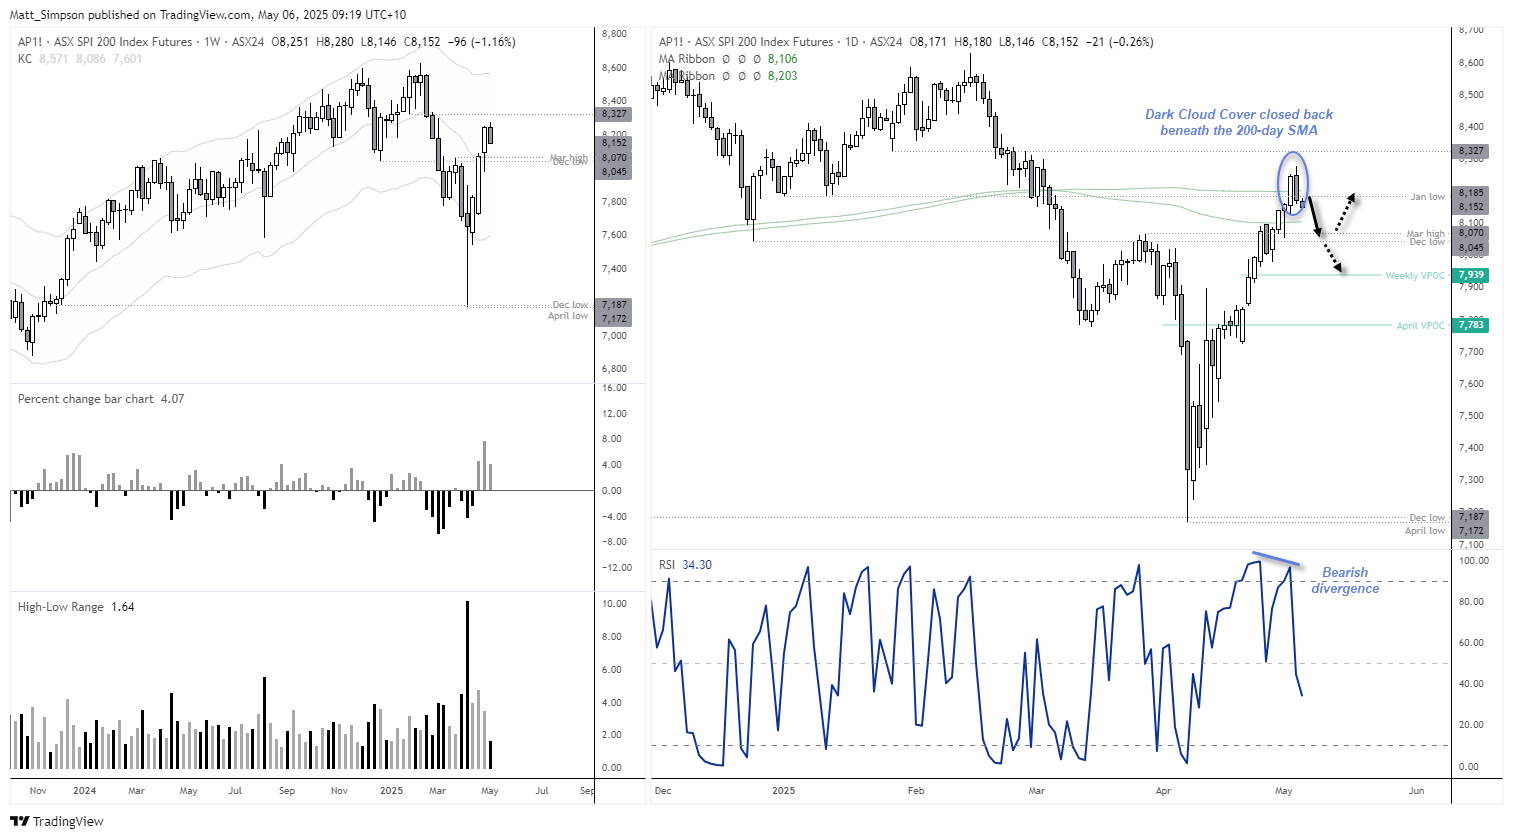
ASX bulls have enjoyed a 15.5% rally over the past 18 trading days, from the April low to Monday’s high. In fact, the ASX 200 has just recorded its strongest three-week rally since November 2020. However, Monday’s -0.9% decline marked its worst daily loss in nearly three weeks and may signal a potential change in character for this leg of the rally.
ASX 200 futures also formed a two-bar bearish reversal pattern known as a dark cloud cover, which closed back beneath the 200-day SMA (simple moving average). Meanwhile, the daily RSI (2) has developed a bearish divergence in overbought territory and closed below 50—an early warning sign of waning momentum. Perhaps we’re finally about to see the pullback I had anticipated last week.
- For today, bears may seek a move to retest the 200-day EMA (exponential moving average) at 8106.
- Note potential support levels around the December low (8045) and March high (8070) if prices break beneath 8100.
- A move below 8045 could see the ASX 200 head towards the weekly VPOC (volume point of control) at 7939.
Economic Events in Focus (AEST / GMT+10)
Public holiday in Japan, South Korea
- 11:00 – New Zealand commodity price index (ANZ)
- 11:30 – Australian building approvals
- 11:45 – Chinese services PMI (Caixin)
- 15:45 – Swiss unemployment
- 17:35 – Swiss National Bank (SNB) Vice Chairman Schlegel Speaks
- 18:00 – EU HCOB Eurozone Composite PMI (Apr)
- 18:30 – UK S&P Global Composite PMI (Apr)
- 19:00 – EU PPI (MoM) (Mar)
- 22:30 – Canadian trade balance (Mar)
- 00:00 – Canadian Ivey PMI (Apr)
-- Written by Matt Simpson
Follow Matt on Twitter @cLeverEdge
How to trade with City Index
You can trade with City Index by following these four easy steps:
- Open an account, or log in if you’re already a customer
• Open an account in the UK
• Open an account in Australia
• Open an account in Singapore
- Search for the market you want to trade in our award-winning platform
- Choose your position and size, and your stop and limit levels
- Place the trade
Related tags:


The complete CFD trading experience
Award-winning platforms, competitive spreads, low commissions and dedicated support.
We live and breathe the markets and are dedicated to helping traders realise their ambitions as we continue to set the industry bar.
Economic calendar
Web Trader platform
Our sophisticated web-based platform is packed with features.
Related articles
Nikkei swings harder than Nasdaq as AI fears deepen
Nikkei 225 volatility is running well ahead of Nasdaq 100, with the index construction and Japan's heavy exposure to AI manufacturing potentially explaining the difference.

Forex & Gold Outlook: Dollar Dominates, Crosses Diverge
The US dollar rally gathers momentum as forex crosses develop contrasting technical setups. Matt Simpson examines eight FX markets and gold for potential trading opportunities.

Gold Outlook: Asia Buys the Dip, US Hammers the Rip
Asia buys the dip, the US sells the rip. Hourly gold, dollar and Treasury yield data reveal a regional divide that has become especially pronounced since September.
StoneX Europe Ltd may make third party material available on this website which may contain information included but not limited to the conditions of financial markets. The material is for information purposes only and does not contain, and should not be construed as containing, investment advice and/or investment recommendation and/or an investment research and/or an offer of or solicitation for any transactions in financial instruments; any decision to enter into a specific transaction shall be made by the client following an assessment by him/her of their situation.
StoneX Europe Ltd makes no representation or warranty and assumes no liability as to the accuracy or completeness of the information provided, nor any loss arising from any investment based on a recommendation, forecast or other information supplied. You should always seek independent advice as to your suitability to speculate in any related markets and your ability to assume the associated risks, if you are at all unsure. We are not under any obligation to update any such material. Any opinion made may be personal to the author and may not reflect the opinion of StoneX Europe Ltd.