



AUD/JPY Dips to Support, Australian Full-Time Jobs Bounce
AUD/JPY holds near key support after Australian full-time jobs surge 60.5k, easing unemployment to 4.1% and tempering RBA rate cut bets.
Share this:

AUD/JPY is holding near key support after Australia’s July jobs report delivered a strong rebound in full-time employment, easing fears of a labour market slowdown. Unemployment fell to 4.1% from 4.2%, with 60.5k full-time jobs added — the fastest monthly rise since February — reversing June’s steep decline. The upbeat data, alongside steady wage growth, has tempered expectations for a September Reserve Bank of Australia rate cut, helping keep the Australian dollar supported against the Japanese yen.
View related analysis:
View related analysis:
Australian Jobs Rebound Supports AUD/JPY at Key Level
Any concern that the Australian employment figures would continue deteriorate were brushed aside with the release of today’s report. Unemployment retreated by -0.1 percentage points to 4.1% and 24.4k jobs were added. Though it was the surge of 60.5k full-time jobs which will likely hog headlines, as it was the fastest month-over-month rise since February, and more than erases the -38.2k decline in June. A separate shows that average weekly earnings rose 4.5% y/y in May in seasonally adjusted terms.
It seemed unlikely that the RBA would rush into another cut in September before the employment figures. And with wages rising above expectations at 3.4% y/y and 0.8% q/q, they have even less reason to rush now.
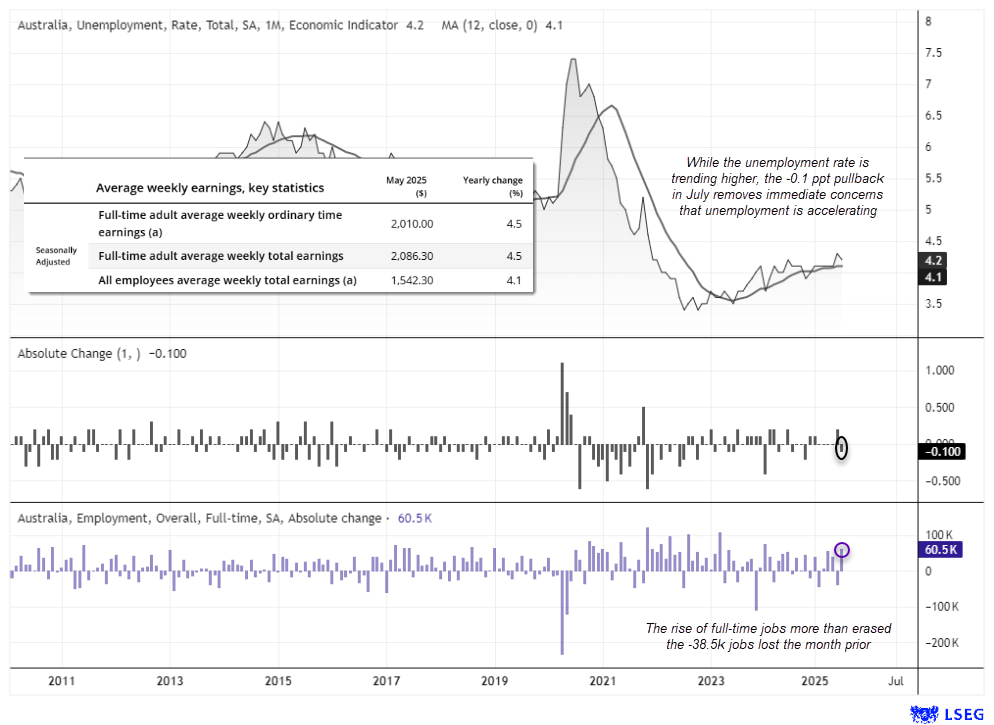
Chart prepared by Matt Simpson - data source: Bureau of Labor Statistics (LBS), London Stock Exchange Group (LSEG)
AUD/JPY Technical Analysis: Australian Dollar vs Japanese Yen
The Australian dollar has maintained a strong uptrend against the Japanese yen, with AUD/JPY climbing more than 13% from the April low to the July high. A bearish engulfing week at the February high signalled the risk of a deeper correction, but buyers stepped in as a bullish engulfing week formed at the 20-week EMA. The 10-week EMA continues to point higher, with AUD/JPY trading comfortably above it.
Price action on the daily chart is also offering bullish clues. AUD/JPY advanced for six consecutive days, and its current two-day retracement remains shallow by comparison. I’m not convinced we’ll see a move back to the 94.50 high-volume node (HVN) without a fresh catalyst or a bout of risk-off sentiment.
Prices are attempting to hold above the 96 handle, which aligns with the weekly and monthly pivot points. Given the bullish technical signals stacking up — alongside Wall Street indices at record highs, the Bank of Japan in no rush to hike rates, and the Reserve Bank of Australia in no hurry to cut — dips beneath 96 still seem more likely to attract buyers than not.
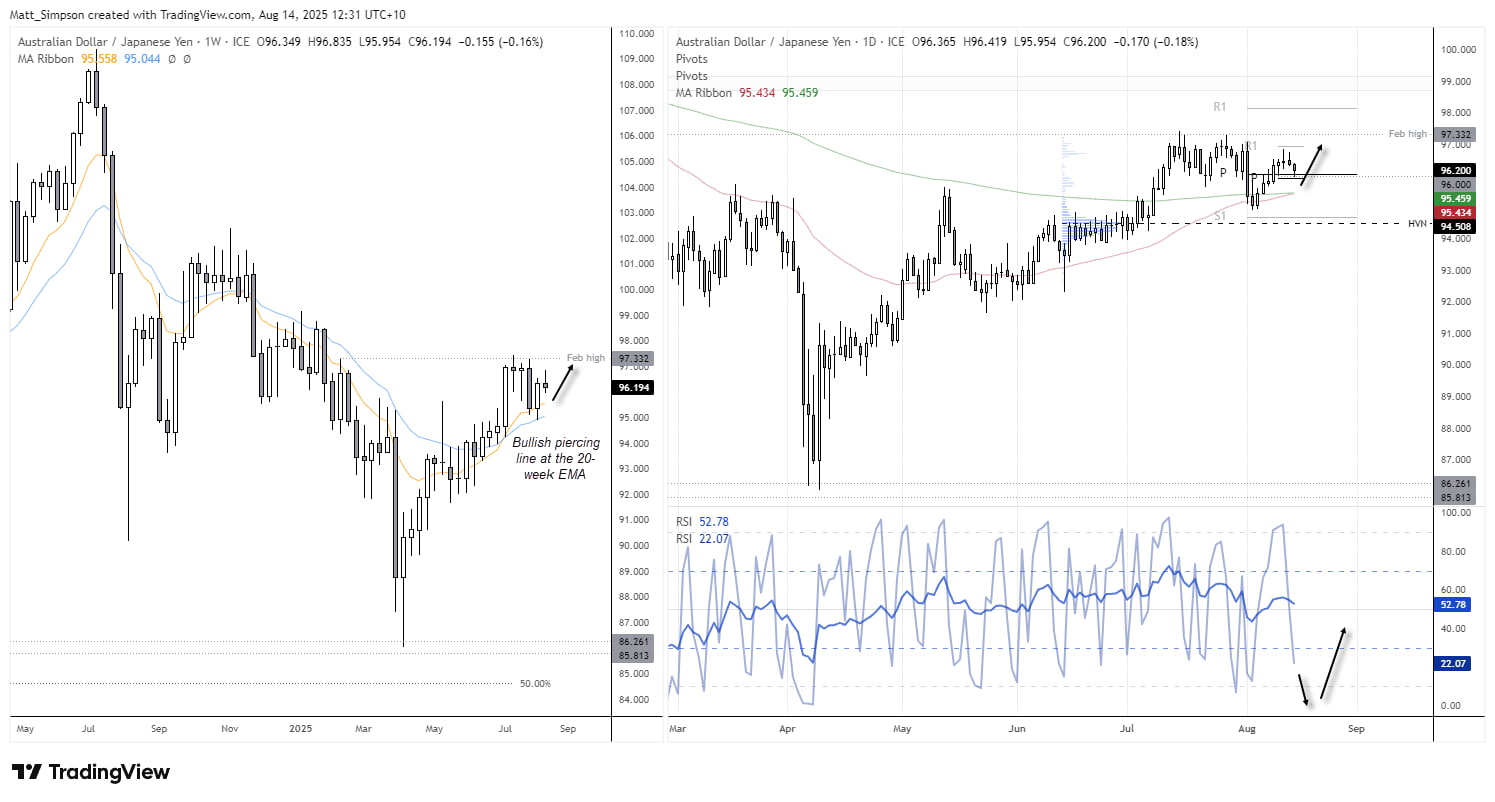
Chart analysis by Matt Simpson - data source: TradingView AUD/JPY
AUD/JPY Technical Analysis: Intraday Chart
The 4-hour chart suggests a potential rounding top pattern may be forming on AUD/JPY. However, the 200-bar EMA and nearby high-volume node (HVN) around 95.82 could act as immediate support. Should prices dip below this area, a rebound back above 95.80 could signal a swing low while the pair holds above the weekly S1 pivot at 95.33.

Chart analysis by Matt Simpson - data source: TradingView AUD/JPY
View the full economic calendar
View the full economic calendar
-- Written by Matt Simpson
Follow Matt on Twitter @cLeverEdge
How to trade with City Index
You can trade with City Index by following these four easy steps:
- Open an account, or log in if you’re already a customer
• Open an account in the UK
• Open an account in Australia
• Open an account in Singapore
- Search for the market you want to trade in our award-winning platform
- Choose your position and size, and your stop and limit levels
- Place the trade
Related tags:


The complete CFD trading experience
Award-winning platforms, competitive spreads, low commissions and dedicated support.
We live and breathe the markets and are dedicated to helping traders realise their ambitions as we continue to set the industry bar.
Economic calendar
Web Trader platform
Our sophisticated web-based platform is packed with features.
Related articles
Euro Technical Forecast: EUR/USD Snaps Five-Week Slide at Critical Support 10 17 2026
Euro is attempting to regain its footing as stretched momentum raises the stakes for the next move ahead of key PMI data and central bank decisions.

USD/JPY Weekly Outlook: Volatility Has Left the Building
The yen has ignored broad dollar weakness, falling Treasury yields and renewed market turbulence. Yet its relationship with US interest rates remains intact. So why is USD/JPY going absolutely nowhere fast?


Swiss Franc Forecast: USD/CHF Seven-Week Rally Reverses From Yearly Highs 10 16 2026
A sharp rejection from fresh highs has shifted momentum in favor of USD/CHF bears, raising the stakes for a critical support test.
StoneX Europe Ltd may make third party material available on this website which may contain information included but not limited to the conditions of financial markets. The material is for information purposes only and does not contain, and should not be construed as containing, investment advice and/or investment recommendation and/or an investment research and/or an offer of or solicitation for any transactions in financial instruments; any decision to enter into a specific transaction shall be made by the client following an assessment by him/her of their situation.
StoneX Europe Ltd makes no representation or warranty and assumes no liability as to the accuracy or completeness of the information provided, nor any loss arising from any investment based on a recommendation, forecast or other information supplied. You should always seek independent advice as to your suitability to speculate in any related markets and your ability to assume the associated risks, if you are at all unsure. We are not under any obligation to update any such material. Any opinion made may be personal to the author and may not reflect the opinion of StoneX Europe Ltd.