







AUD/USD, NZD/USD Track Wall Street, Yields Higher Amid Risk-Off Fatigue
Like clockwork, Wall Street indices extended their bounce for a second day after the S&P 500 reached the 10% ‘technical correction’ level on Thursday, with AUD/USD and NZD/USD also getting a tailwind from positive China data and comments from US Treasury Secretary Scott Bessent.
Share this:

View related analysis:
- EUR/USD Flips to Net-Long, Yen Hints at Sentiment Extreme: COT Report
- AUD/USD Forecast: FOMC, AU Jobs to Wake the Aussie Up From Its Lull?
- Crude Oil Forecast: Short Covering and WTI Spread Hint at Bounce
View related analysis:
- EUR/USD Flips to Net-Long, Yen Hints at Sentiment Extreme: COT Report
- AUD/USD Forecast: FOMC, AU Jobs to Wake the Aussie Up From Its Lull?
- Crude Oil Forecast: Short Covering and WTI Spread Hint at Bounce
Wall Street indices extended their bounce for a second day on Monday, almost like clockwork after the S&P 500 officially entered the 10% ‘technical correction’ on Thursday. I swear this happens every time headlines celebrate the 10% or 20% ‘technical bear market’ thresholds.
Data from the US was overall. While retail sales was a miss at 0.2% m/m, compared with 0.6%W forecast, retail control (which strips out volatile items) was a beat at 1% and core retail sales landed on target at 0.3% m/m. A measure of US manufacturing activity plunged at its fastest pace in a year.
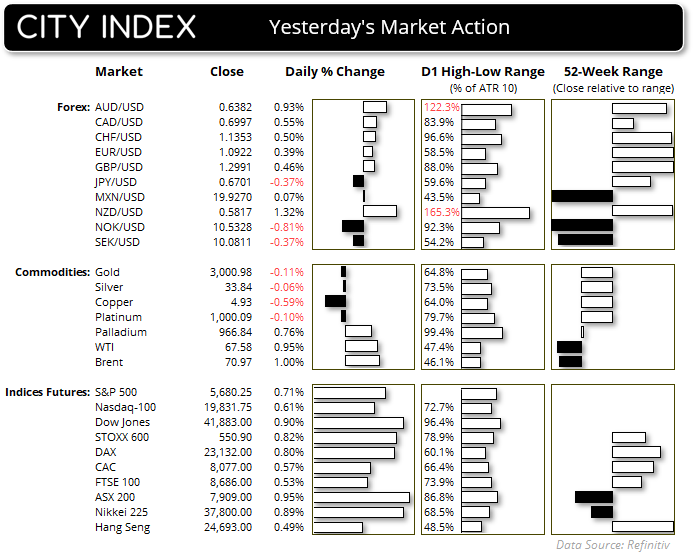
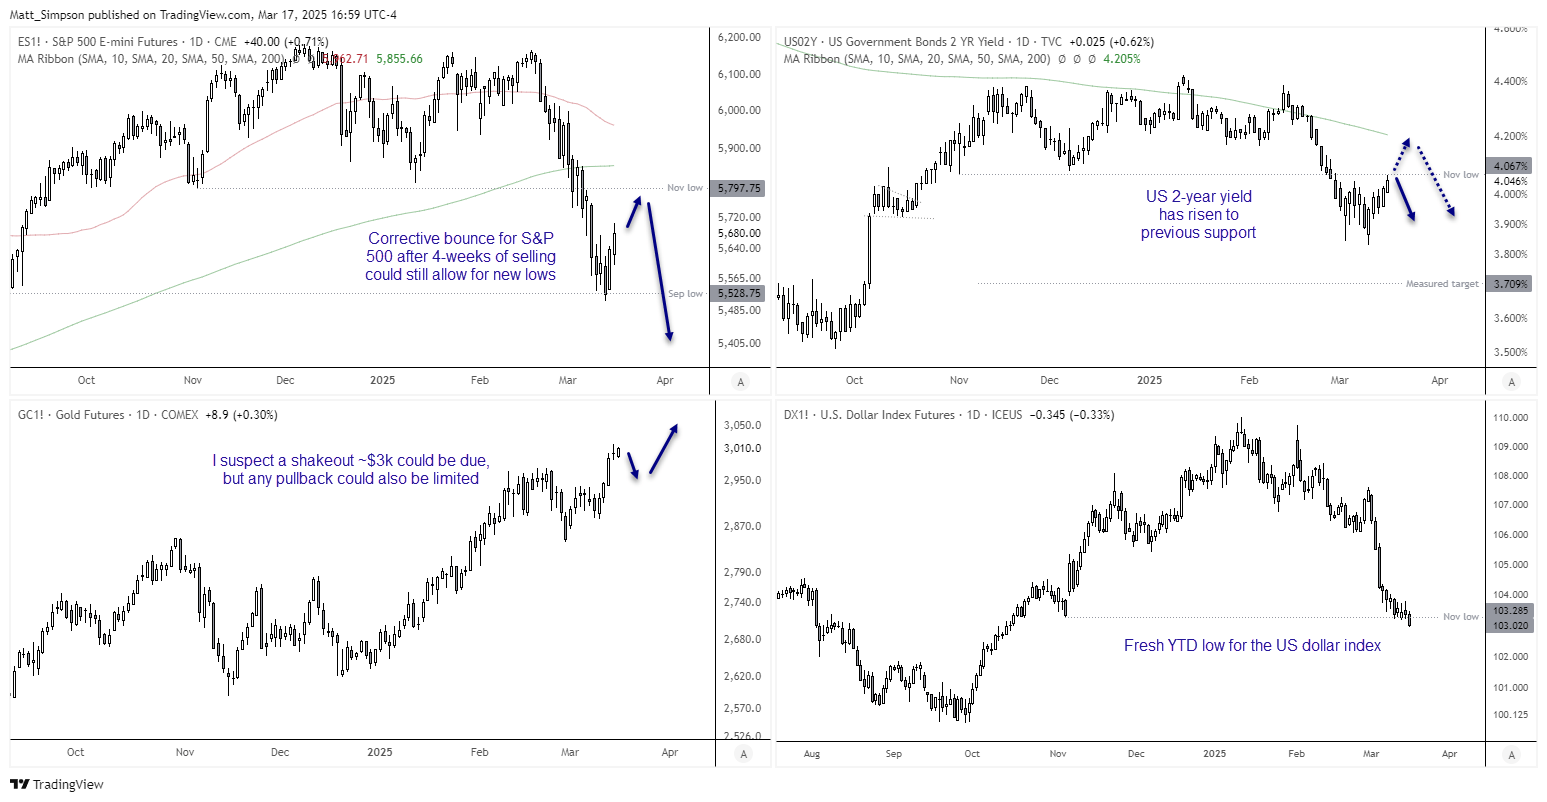
But investors are fatigued of tariff headlines, and after four weeks of selling on Wall Street a corrective bounce could not arrive soon enough. Treasury Secretary also soothed investor concerns by saying “corrections are healthy” and that he’s not worried about it, adding that “markets will do great” over the long term if good tax policies, deregulation and energy security are in place.
Trump is set to speak with Putin today to discuss the end of the Ukraine war, which when combined with the positive data from China is a breath of fresh air for risk appetite.
Data from China on Monday was a net-positive overall, with retail sales, industrial production and fixed asset investment coming in above expectations. Retail sales rose 4%, above the 3.8% forecast and prior read, industrial production rose 5.9% y/y compared with 3.3% estimated though slower than the 6.2% prior. However, unemployment increased to 5.4%, compared with 5.1% estimated and prior.
- The US 2-year yield reached a 2-week high, though for now the bounce appears to be corrective (which could imply lower yields)
- Gold futures remain just off their record high around $3010, with my anticipated shakeout yet to materialise (though further gains beyond any such breakout seems likely)
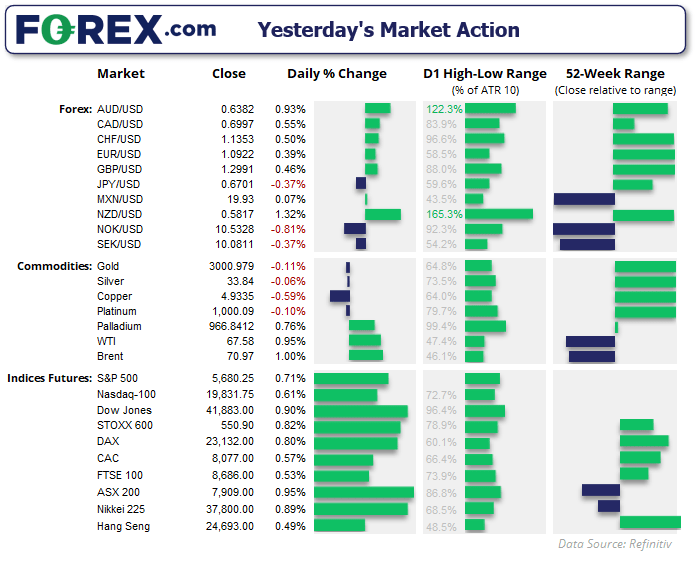
- NZD/USD and AUD/USD were the strongest FX majors while USD was the weakest
- The US dollar index is below 103 and trades at its lowest point since October ahead of this week’s FOMC meeting
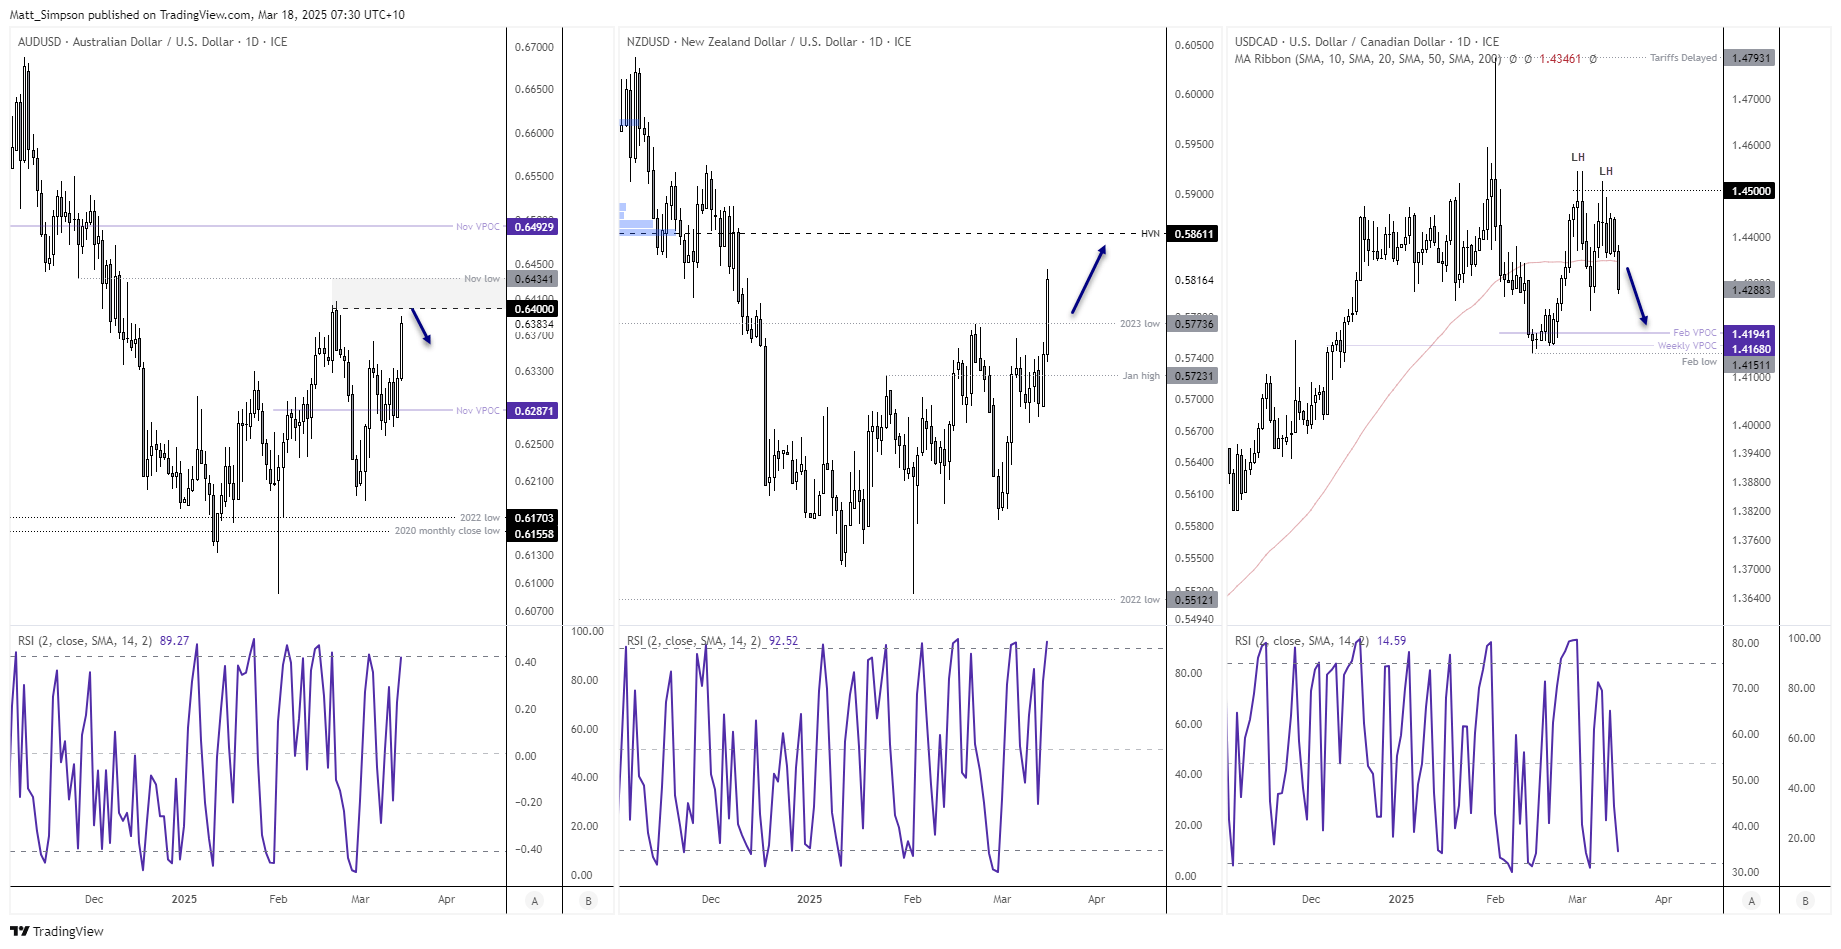
- NZD/USD broke to a year-to-date high, AUD/USD is hovering just below 64c resistance
- USD/CAD was down for a second day to a 7-day low ahead of a key CPI report from Canada
- Hang Seng futures rose to a 6-day high on Monday to expand on Friday’s rebound from the October high, in line with my bias discussed in Friday morning’s report
AUD/USD, NZD/USD, USD/CAD technical analysis
AUD/USD rose in line with my bullish bias, though it provided no pullback within Friday’s range beforehand. 64c and the February high at 0.6408 is a key barrier for bulls to conquer, but even then the November high sits just 30-pips higher to scupper any upside move. So unless the US dollar extends its tumble below 103, we could find these early-week risk-on moves to be limited as we head into the FOMC meeting on Wednesday.
NZD/USD is the true leader of the pack, breaking above the Feb high / 2023 low and 58c handle on Monday. And a move up to the high-volume node (HVN) at 0.5861 is now in focus. This could see AUD/NZD head down to the December low at 1.0930 in due course.
USD/CAD saw a clear break of its 50-day SMA on Monday. And with its second lower high around 1.45 (since the tariff-delay peak at 1.48), my somewhat belated bearish bias could finally come to fruition. 1.42 makes a sensible target for bears over the near term, with the February VPOC sitting near the February low nearby,
Economic events in focus (AEDT)
- 19:00 – Swiss SECO economic forecasts
- 21:00 – German, EU ZEW economic indicator
- 22:00 – German Buba monthly report
- 23:30 – US import price index, building permits, housing starts
- 23:30 – Canadian core inflation
- 00:15 – US industrial production, manufacturing production, capacity utilisation
ASX 200 at a glance
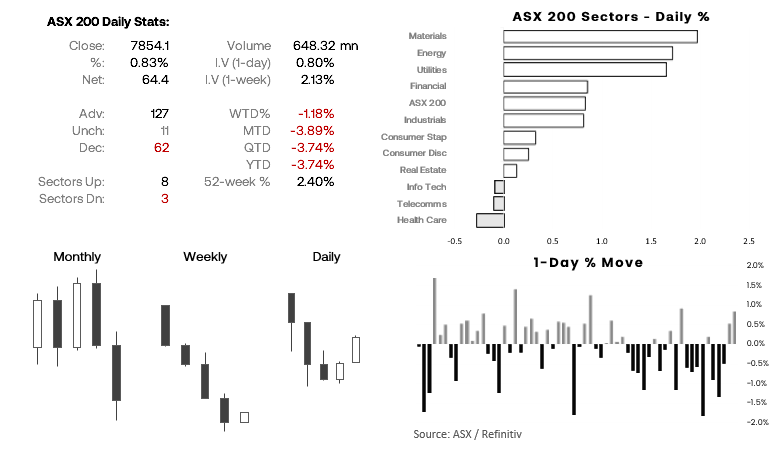
- The ASX 200 closed lower for a fourth consecutive week on Friday, though we’ve now seen two bullish days since Thursday’s low
- 8 of the 11 ASX 200 sectors advanced (led by materials and energy), 3 declined (led by Healthcare and Telecomms)
- Implied volatility remains elevated, but is falling from recent highs
- Oversold conditions favour a bounce
-- Written by Matt Simpson
Follow Matt on Twitter @cLeverEdge
How to trade with City Index
You can trade with City Index by following these four easy steps:
- Open an account, or log in if you’re already a customer
• Open an account in the UK
• Open an account in Australia
• Open an account in Singapore
- Search for the market you want to trade in our award-winning platform
- Choose your position and size, and your stop and limit levels
- Place the trade
Related tags:
Latest market news




The complete CFD trading experience
Award-winning platforms, competitive spreads, low commissions and dedicated support.
We live and breathe the markets and are dedicated to helping traders realise their ambitions as we continue to set the industry bar.
Economic calendar
Web Trader platform
Our sophisticated web-based platform is packed with features.
Related articles
US Dollar Short-term Outlook: USD Rally on the Line as Midterms, NFP Loom 11 3 2026
DXY is testing pivotal support, with the weekly range breakout likely to determine the next major leg of the trend as key event risk unfolds.

Nasdaq 100 forecast: Stocks rebound but AI concerns linger
The Nasdaq 100 was finding some support at 28,000 after recent sell-off amid concerns about the AI trade. Even with oscillators oversold, the risk to the near-term forecast is tilted to the downside.

Australian Dollar Technical Outlook: AUD/USD October Breakout Reverses Toward Critical Support 11 3 2026
Aussie bulls face a critical test of rising trend support, with the October recovery under threat as selling pressure builds into November.
StoneX Europe Ltd may make third party material available on this website which may contain information included but not limited to the conditions of financial markets. The material is for information purposes only and does not contain, and should not be construed as containing, investment advice and/or investment recommendation and/or an investment research and/or an offer of or solicitation for any transactions in financial instruments; any decision to enter into a specific transaction shall be made by the client following an assessment by him/her of their situation.
StoneX Europe Ltd makes no representation or warranty and assumes no liability as to the accuracy or completeness of the information provided, nor any loss arising from any investment based on a recommendation, forecast or other information supplied. You should always seek independent advice as to your suitability to speculate in any related markets and your ability to assume the associated risks, if you are at all unsure. We are not under any obligation to update any such material. Any opinion made may be personal to the author and may not reflect the opinion of StoneX Europe Ltd.