










EUR/USD Flips to Net-Long, Yen Hints at Sentiment Extreme: COT Report
Large speculators flipped to net-long exposure EUR/USD futures for the first week in 21, and while they extended their bullish exposure to Japanese yen futures, it could be nearing a sentiment extreme. So USD/JPY bears may want to tread with caution.
Share this:
View related analysis:
- AUD/USD Forecast: FOMC, AU Jobs to Wake the Aussie Up From Its Lull?
- Tentative signs of reversals for EUR/USD, commodity FX: COT report
- Gold forecast: Another solid run, though a 3k shakeout seems likely
- AUD/USD rises, EUR/USD, USD/CAD dip, US dollar selloff loses steam
View related analysis:
- AUD/USD Forecast: FOMC, AU Jobs to Wake the Aussie Up From Its Lull?
- Tentative signs of reversals for EUR/USD, commodity FX: COT report
- Gold forecast: Another solid run, though a 3k shakeout seems likely
- AUD/USD rises, EUR/USD, USD/CAD dip, US dollar selloff loses steam
Market positioning from the COT report – 11 March 2025:
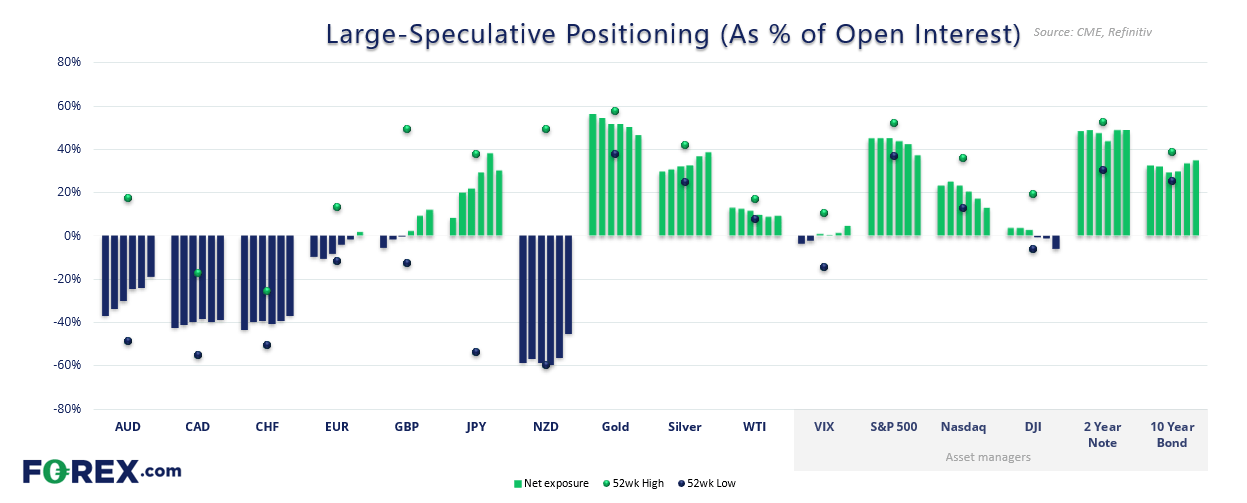
- Net-long to the US dollar dell -$4.8 billion last week, marking its sixth consecutive weekly decline (although the pact slowed for a second week)
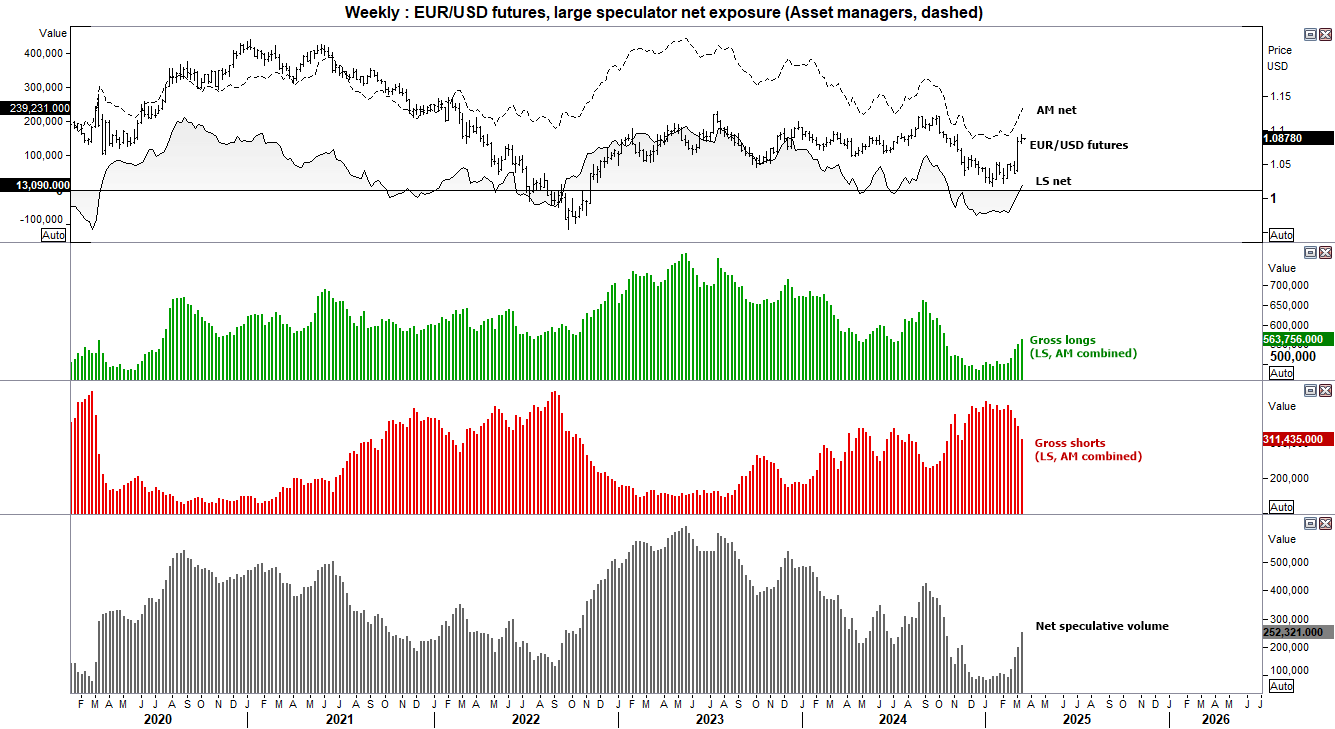
- Large speculators flipped to net-long EUR/USD exposure for the first time in 21 weeks
- They also increased their net-long exposure to GBP/USD futures to a 16-week high
- Net-long exposure to JPY/USD futures inched its way to a record high with an increase of 251 contracts
- Open interest to AUD/USD futures reached a record high, although speculative volumes were down for the week to suggest the rise in volumes were for hedges
- Net-long exposure to silver futures reached a YTD high while net-long exposure to gold futures fell to a YTD low


US dollar positioning (IMM data) – COT report:
Net-long exposure to US dollar futures fell to a 21-week low according to data from the International Money Market (IMM). It also marked the sixth week that net-long exposure declined (or seventh out of eight), leaving net-long exposure at $4.2 billion.
Asset managers accelerated their reduction of net-long exposure to USD dollar index futures, with the -4.5k reduction being its fastest week-over-week decline since July.
Foe now, the US dollar index is trying to hold above the 61.8% Fibonacci ratio and above the November low. Given the USD index just suffered its worst week since November 2022 and the potential for the Fed not to be as dovish as hoped this week, I am on guard for at least a minor bounce higher for the US dollar.

EUR/USD (Euro dollar futures) positioning – COT report:
Large speculators finally reverted to net-long EUR/USD exposure last week. Gross-shorts were closed for a fifth consecutive week, and -19.7k contracts (-10.1%) it was its fastest pace of short-covering since November. Gross longs rose for a sixth week, although at a slower pace of 3.4k contracts.
Asset managers pushed their net-long exposure to a 22-week high, added 9k long contracts and reduced shorts by -135.9k contracts.
Overall, speculative volumes (asset managers and large speculators combined) is rising alongside EUR/USD prices to show some weight behind the bullish move.
JPY/USD (Japanese yen futures) positioning – COT report:
Net-long exposure to Japanese yen futures reached a new record last week among large speculators. But only just. The mere 251 contract increase shows a sudden loss of momentum, compared to the recent increases in excess of 30k contracts each week.
Moreover, gross longs and shorts were trimmed among large speculators and asset managers, which saw overall volumes from these traders combined dop for a second consecutive week.
This builds to the case that market positioning against short USD/JPY could be at or near an extreme, and builds a case for a counter-trend move.
S&P 500 futures (ES) positioning – COT report:
Wall Street’s indices fell for a fifth week, its first such bearish run for the S&P 500 since May 2022. It also entered a ‘technical correction’ by closing 10% lower from its cycle high. The question now of course is whether this is simply part of a correction or we’ll head into a bear market.
Net-long exposure to the S&P 500 fell to a 10-week low among asset managers, who are also the least bullish on Nasdaq futures since April 2023. Net-short exposure to Dow Jones futures also rise to its highest level since November 2023.
I suspect this is more than just a correction, and that we could be headed for a bear market. But those who have traded bear markets also know that they are susceptible to nasty bear-market bounces, which can lull investors into a false sense of security before momentum turns south quickly once more.
Gold (GC), Silver (SI) futures positioning – COT report:
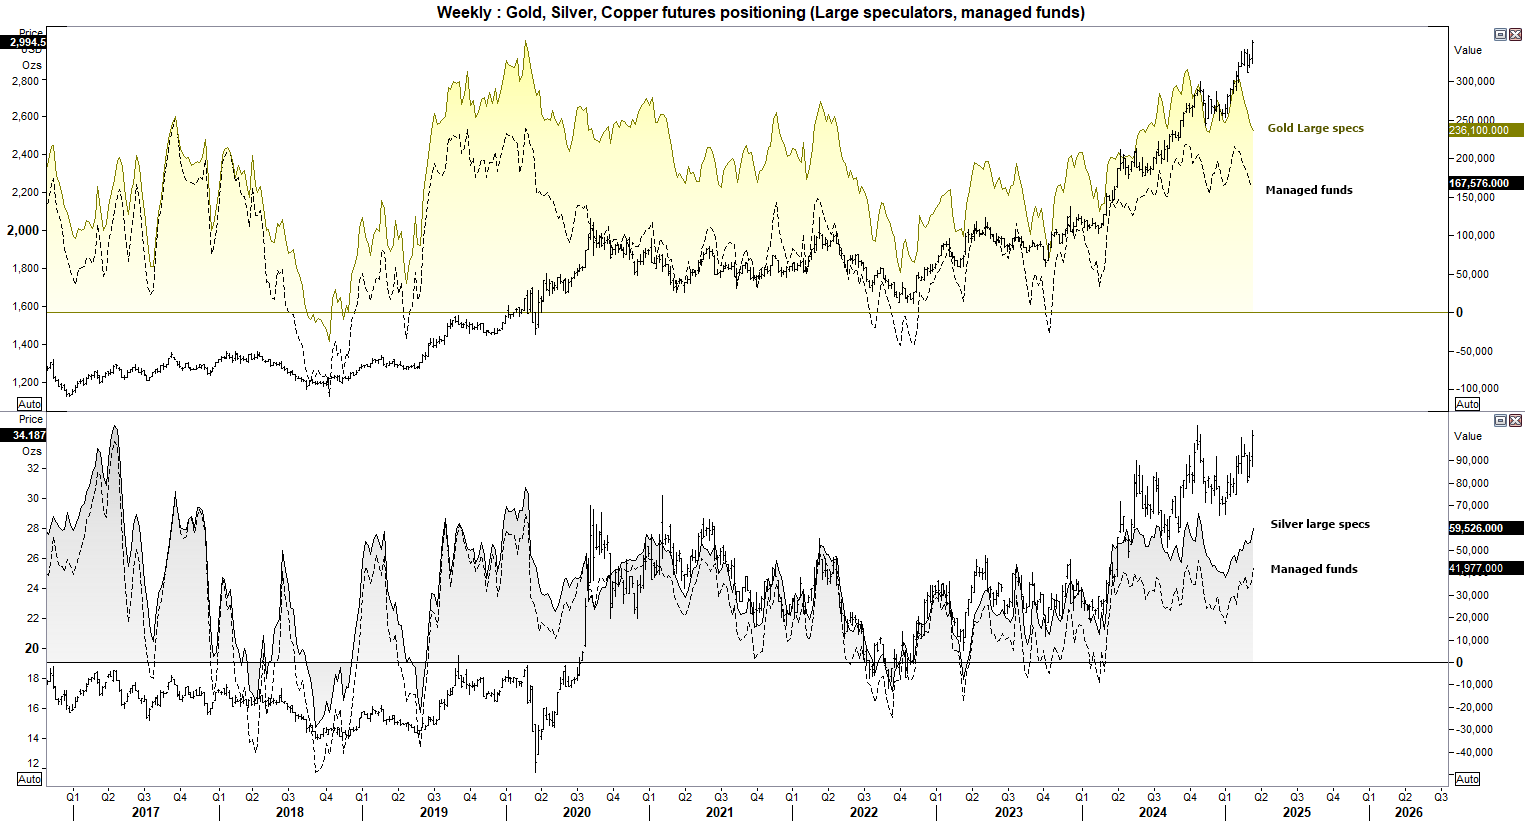
Last week I noted that gold futures traders may end up chasing this move higher, given prices have accelerated their way to $3k with many on the side line. For several weeks, large speculators and managed funds were trimming longs, presumably in the hopes of a pullback that didn’t materialise.
There’s a reasonable chance we’ll see a pullback from the $3k area given its significance as a milestone, but I’m not convinced it will be a deep pullback given market positioning is not at a sentiment extreme.
Meanwhile, silver prices are also on the verge of a breakout. Although this time, futures traders are increasing their net-long exposure along the way. But we’ll also need to see gold accelerate above $3k before I become more convinced that any breakout on silver will hold. We also need to factor in the potential for a minor US dollar bounce over the near-term.
WTI crude oil (CL) positioning – COT report:
Net-long exposure increased for large specs and asset managers last week, for the first time since mid-January. It was also the second week both parties trimmed gross-shorts, and as longs were also trimmed (to a lesser degree) then speculative volume was lower.
There seems to no immediate appetite to be long WTI, but at the same time there is strong cautions from bears at these lows. I tentatively remain bullish over the near-term, given the plethora of long-term support levels nearby and the fact that we’ve seen a multi-week selloff already.
How to trade with City Index
You can easily trade with City Index by using these four easy steps:
- Open an account, or log in if you’re already a customer
• Open an account in the UK
• Open an account in Australia
• Open an account in Singapore
- Search for the company you want to trade in our award-winning platform
- Choose your position and size, and your stop and limit levels
- Place the trade
Latest market news



The complete CFD trading experience
Award-winning platforms, competitive spreads, low commissions and dedicated support.
We live and breathe the markets and are dedicated to helping traders realise their ambitions as we continue to set the industry bar.
Economic calendar
Web Trader platform
Our sophisticated web-based platform is packed with features.
Related articles
Gold Rallies Towards a $4k Test – but Can Bulls Break the Trend?
Gold prices melted down last week but so far this week, a different tone has taken over. But can this turn into anything more than a short squeeze?
US Dollar, GBP/USD, USD/CAD, USD/CHF, Gold Weekly Technical Outlook 11 2 2026
Sr. Technical Strategist Michael Boutros highlights the levels that matter on the USD Majors, commodities, and equity indices charts this week.

US Midterm Forecast: The Key Risks for Traders to Watch Through the US Elections
Prediction markets are pricing in nearly 75% odds of a Democratic sweep in this week’s US midterm elections, a development that would result in a split from the single party Republican rule of the past two years - what will it mean for markets?

StoneX Europe Ltd may make third party material available on this website which may contain information included but not limited to the conditions of financial markets. The material is for information purposes only and does not contain, and should not be construed as containing, investment advice and/or investment recommendation and/or an investment research and/or an offer of or solicitation for any transactions in financial instruments; any decision to enter into a specific transaction shall be made by the client following an assessment by him/her of their situation.
StoneX Europe Ltd makes no representation or warranty and assumes no liability as to the accuracy or completeness of the information provided, nor any loss arising from any investment based on a recommendation, forecast or other information supplied. You should always seek independent advice as to your suitability to speculate in any related markets and your ability to assume the associated risks, if you are at all unsure. We are not under any obligation to update any such material. Any opinion made may be personal to the author and may not reflect the opinion of StoneX Europe Ltd.