





AUD/USD, US dollar, Swiss franc analysis: COT report – Feb 26, 2024
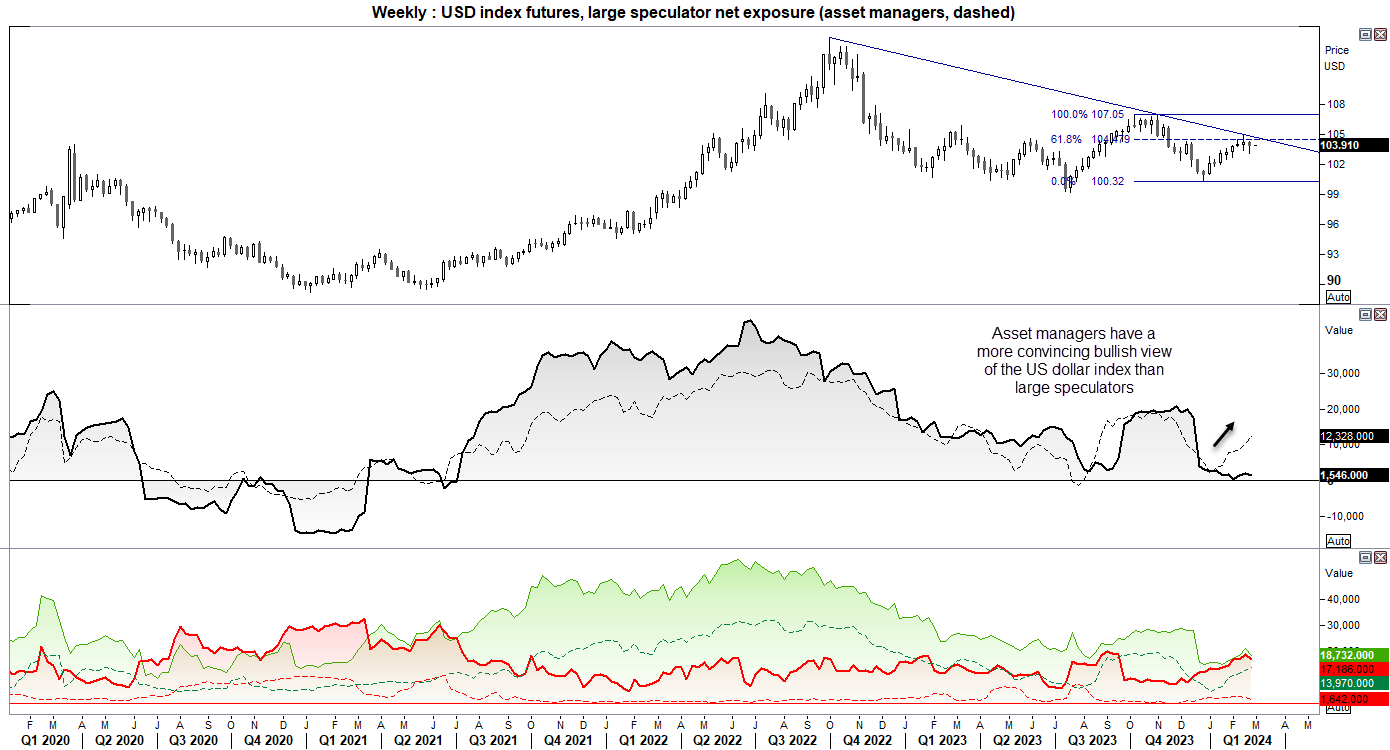
Traders remained net-long US dollar index futures last week, although asset managers have the more convincing bullish view for the dollar.
Share this:
View the latest commitment of traders reports
View the latest commitment of traders reports
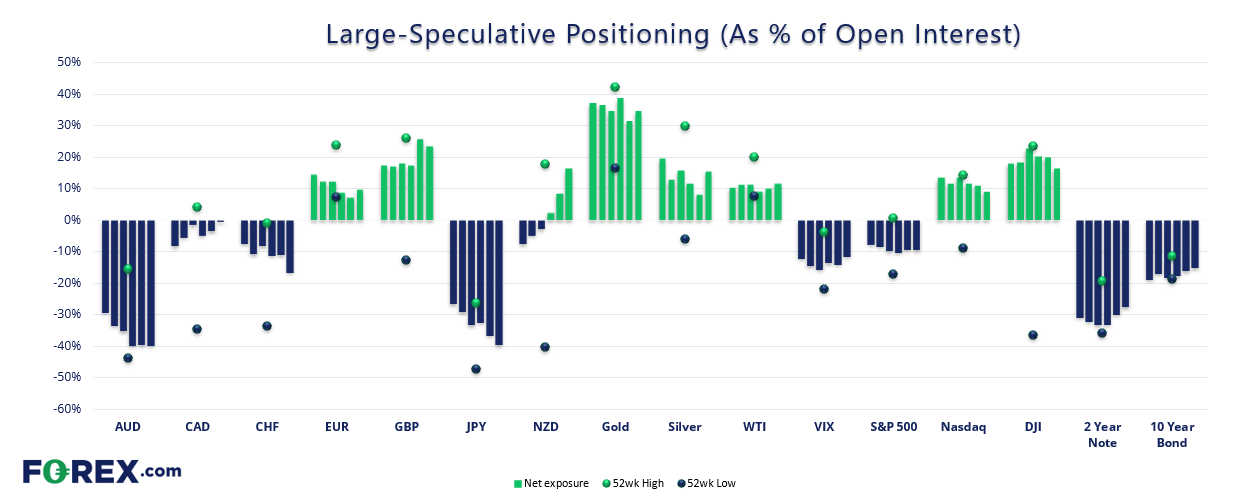
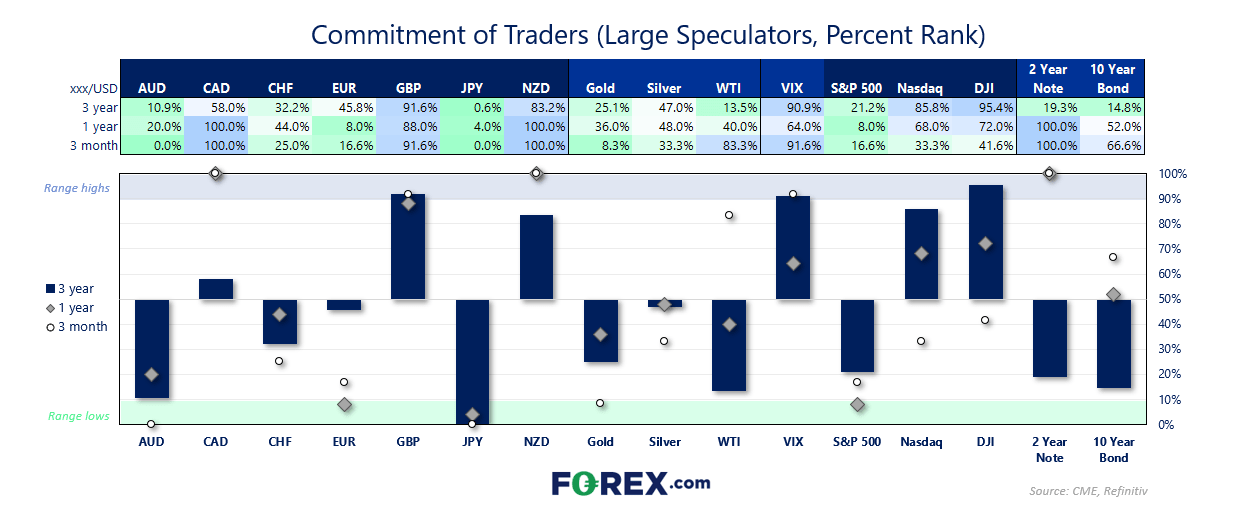
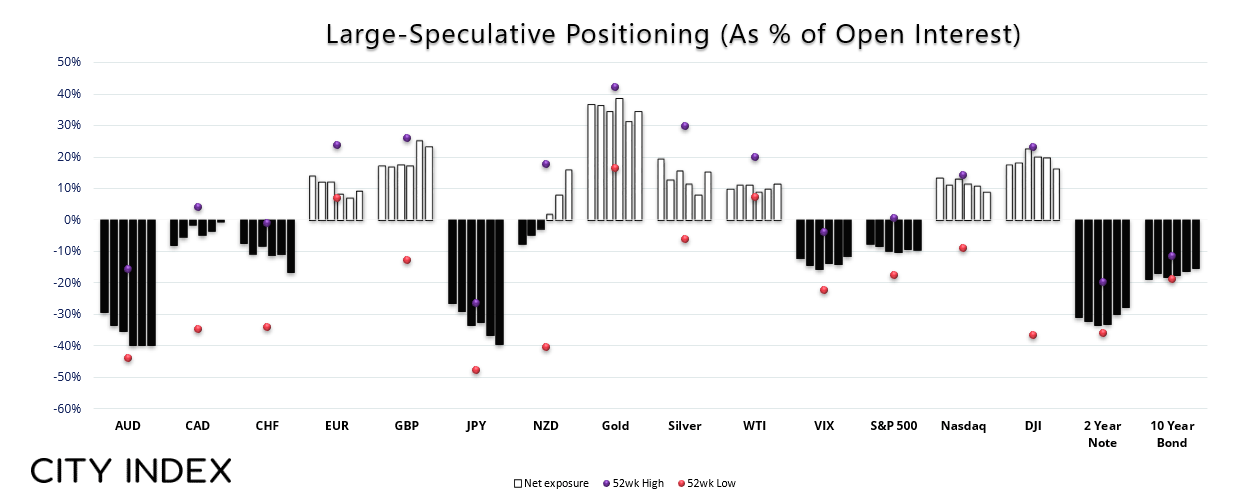
Market positioning from the COT report - as of Tuesday 20th Feb, 2024:
- Net-short exposure to Japanese yen futures rose to a 14-week high
- Gross-short exposure to Swiss franc futures increased by 22.8% (+4.3k contracts)
- Large speculators increased gross-short exposure to Dow Jones futures by 26.6% (+3.3k contracts)
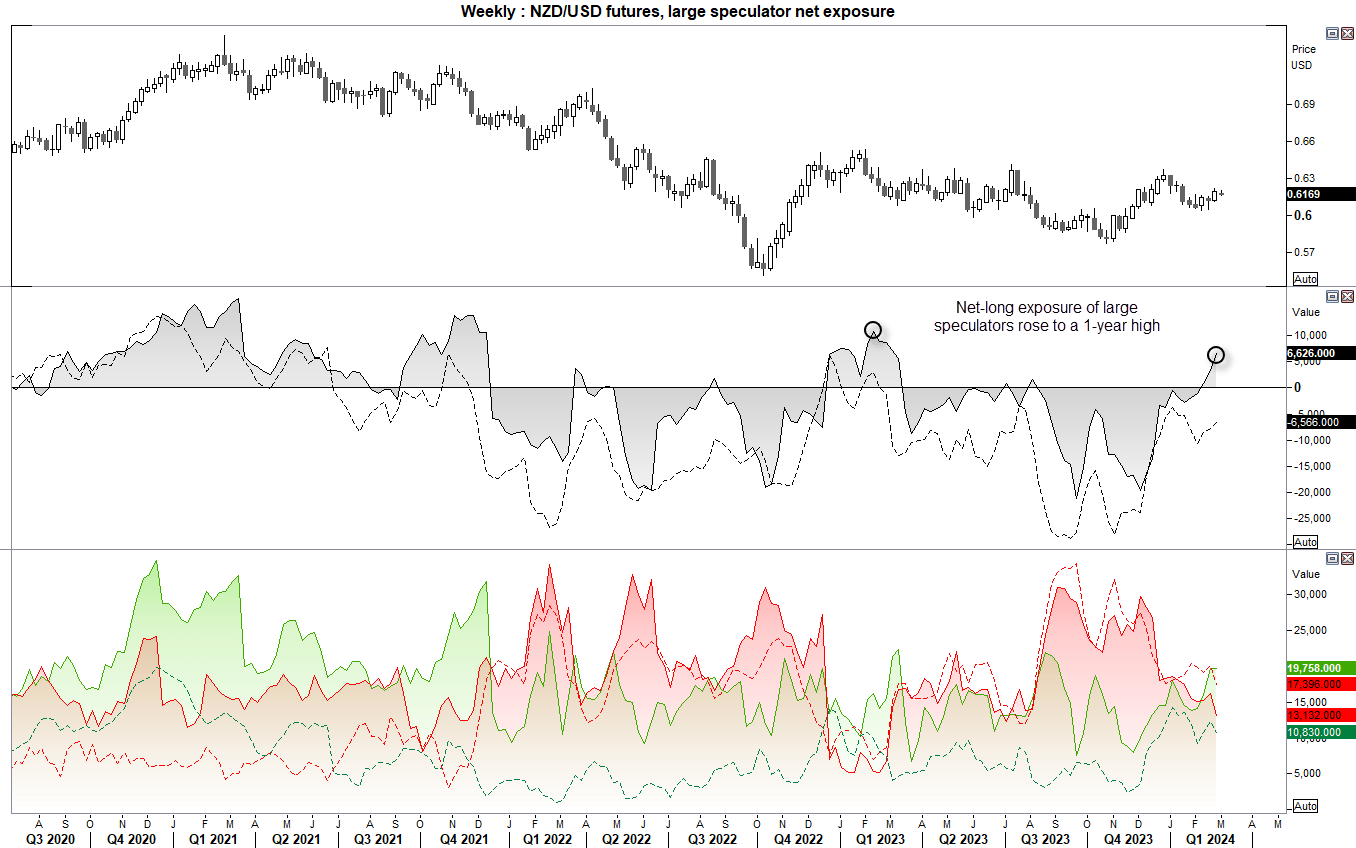
- Traders reduced gross-short exposure to NZD/USD futures by -19.1%
- This saw net-long exposure to NZD/USD futures rise to a 52-week high
- Net-short exposure to AUD/USD futures rose to a 17-week high

US dollar index – COT report:
Both large speculators and asset managers remain net-long the US dollar index, although it is the latter which has the more convincing bullish view. Net-long exposure of asset managers has risen to a 12-week high, with net-long exposure rising and net-short exposure falling. The weekly chart shows that prices remain beneath the 61.8% Fibonacci level and trend resistance, and whilst DXY closed lower last week it managed to recoup much of the week’s losses. It appears that the US dollar index has entered a period of consolidation, and that could remain the case until we receive the numbers from this week’s PCE inflation report. But with the Fed pushing back on cuts, if a hot inflation set is delivered then a move to and beyond 105 seems feasible.
CHF/USD (Swiss franc futures) positioning – COT report:
Net-short exposure to the Swiss franc has risen to a 10-week high among large speculators. The SNB have moved away from wanting a stronger Swiss franc, and there has been some speculation that the central bank may ease ahead of the ECB. Still, this does not appear to be a full-drawn conclusion with gross-long positions also on the rise – even if they’re being outpaced by the rise of gross shorts.
AUD/USD (Australian dollar futures) positioning – COT report:
Shorting the Australian dollar is not exactly a new idea, with large speculators and asset managers remaining net short AUD futures since Q1 2021. But it is possible that bears may be fast approaching a sentiment extreme. Gross short exposure for large speculators and asset managers rose to a 22-week high last week, which dragged net-short exposure to a 21-week high with large speculators and asset managers are very close to a record high of net-short exposure.
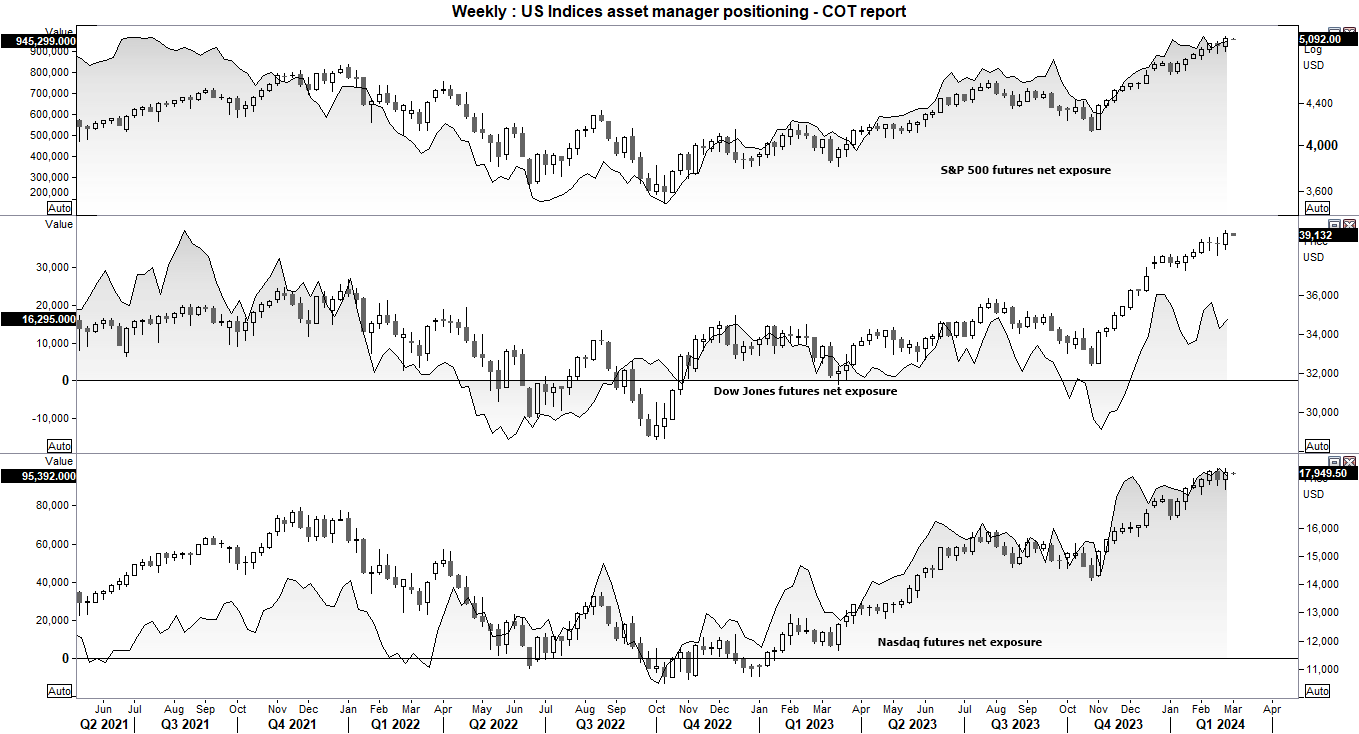
S&P 500, Nasdaq 100, Dow Jones Industrial futures positioning – COT report:
Nvidia single-handedly drove sentiment for US indices last week, which saw the Dow Jones and S&P 500 futures markets close at a record high. Net-long exposure is more of less tracking price action higher for the S&P 500 and Nasdaq. Yet there is a divergence on the Dow Jones among asset managers. Large speculators also increased their gross-short exposure to Dow Jones futures, suggesting that both sets of traders are less confident in this particular index despite it rising ot record highs.
NZD/USD (New Zealand dollar futures) positioning – COT report:
Large speculators were net-long NZD/USD futures for a third week, and at their most bullish level since in one year. Yet the move has been powered by short covering as opposed to the initiation of new longs. Asset managers remain net short, and gross longs and shorts were reduced by both sets of traders last week. O whilst net-long exposure is rising, it seems to be due to a less bearish view of NZD as opposed to it being more bullish. Take note that the RBNZ hold their monetary policy meeting this week, and whilst a hold is expected they might slip a hawkish bias into the statement, press conference or updated forecasts. And that could spur the initiation of bullish bets.
How to trade with City Index
You can easily trade with City Index by using these four easy steps:
- Open an account, or log in if you’re already a customer
• Open an account in the UK
• Open an account in Australia
• Open an account in Singapore
- Search for the company you want to trade in our award-winning platform
- Choose your position and size, and your stop and limit levels
- Place the trade
Related tags:


The complete CFD trading experience
Award-winning platforms, competitive spreads, low commissions and dedicated support.
We live and breathe the markets and are dedicated to helping traders realise their ambitions as we continue to set the industry bar.
Economic calendar
Web Trader platform
Our sophisticated web-based platform is packed with features.
Related articles
Nikkei swings harder than Nasdaq as AI fears deepen
Nikkei 225 volatility is running well ahead of Nasdaq 100, with the index construction and Japan's heavy exposure to AI manufacturing potentially explaining the difference.

Forex & Gold Outlook: Dollar Dominates, Crosses Diverge
The US dollar rally gathers momentum as forex crosses develop contrasting technical setups. Matt Simpson examines eight FX markets and gold for potential trading opportunities.

Gold Outlook: Asia Buys the Dip, US Hammers the Rip
Asia buys the dip, the US sells the rip. Hourly gold, dollar and Treasury yield data reveal a regional divide that has become especially pronounced since September.
StoneX Europe Ltd may make third party material available on this website which may contain information included but not limited to the conditions of financial markets. The material is for information purposes only and does not contain, and should not be construed as containing, investment advice and/or investment recommendation and/or an investment research and/or an offer of or solicitation for any transactions in financial instruments; any decision to enter into a specific transaction shall be made by the client following an assessment by him/her of their situation.
StoneX Europe Ltd makes no representation or warranty and assumes no liability as to the accuracy or completeness of the information provided, nor any loss arising from any investment based on a recommendation, forecast or other information supplied. You should always seek independent advice as to your suitability to speculate in any related markets and your ability to assume the associated risks, if you are at all unsure. We are not under any obligation to update any such material. Any opinion made may be personal to the author and may not reflect the opinion of StoneX Europe Ltd.