







AUD/USD, AUD/JPY: Reversal Risks Emerge Near Key Resistance
The Australian dollar extended its recovery this week, but signs of exhaustion are appearing as AUD/USD and AUD/JPY approach key resistance levels. A bearish reversal pattern has formed on AUD/JPY, and AUD/USD is testing the 61.8% Fibonacci retracement level — both raising the risk of a short-term pullback.
Share this:

The Australian dollar has steadily climbed this week, supported by broader market sentiment. However, price action now suggests that AUD/USD and AUD/JPY may be running out of steam. With key resistance levels being tested and early signs of bearish reversals emerging, traders may begin to question the sustainability of the Aussie’s recent strength.
View related analysis:
View related analysis:
- AUD/USD Outlook: Headwinds from China Data and RBA Policy
- US Dollar Outlook: Don’t Write Off the USD Just Yet
- Gold Outlook: Seasonal Weakness and Fading Momentum Hint at June Pullback
- USD/CAD, AUD/JPY Outlook: Trade Hopes Fuel Commodity FX Strength
AUD/USD, AUD/JPY: Aussie Exhaustion Signals a Pullback?
AUD/USD Technical Analysis: Australian Dollar vs US Dollar
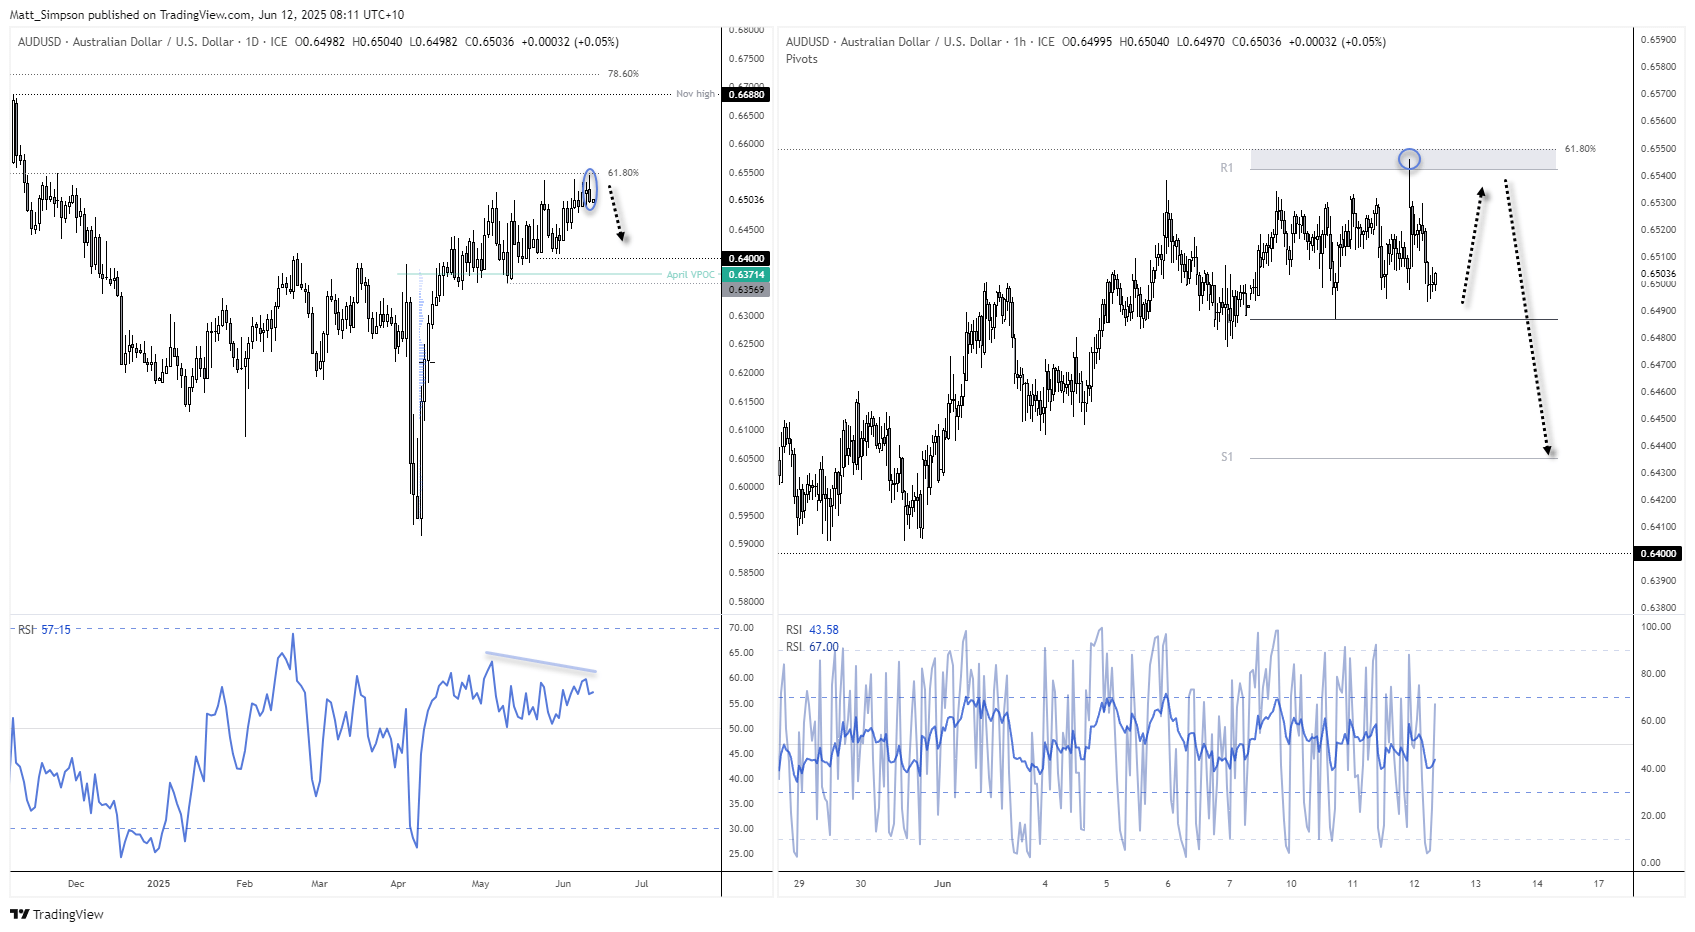
The Australian dollar (AUD/USD) continues to grind higher, but price action still carries the hallmarks of a broader sideways range. Despite printing fresh highs, this slow and steady climb often precedes a sharper downside move.
While the upper boundary of the range has shifted from 0.64 to 0.65 and now approaches 0.6550, there are signs that bearish momentum could soon return. Importantly, AUD/USD is now testing the longer-term 61.8% Fibonacci retracement level at 0.6549 — a zone that may act as strong resistance. A rejection from this level could spark a swift downside move in the Australian dollar against the US dollar, even if only temporarily.
Notably, Wednesday’s spike higher in AUD/USD stalled between the 61.8% Fibonacci retracement level and the monthly R1 pivot point — a confluence that adds weight to this resistance zone. Currently, AUD/USD is hovering just above the monthly pivot point at 0.6487, which could act as a short-term support level and trigger a minor bounce.
However, unless broader sentiment shifts significantly, bears may look to fade rallies towards the upper end of the current intraday range. On the 1-hour chart, this could offer tactical short opportunities in the Australian dollar against the US dollar as momentum stalls near key resistance levels.
AUD/JPY Technical Analysis: Australian Dollar vs Japanese Yen
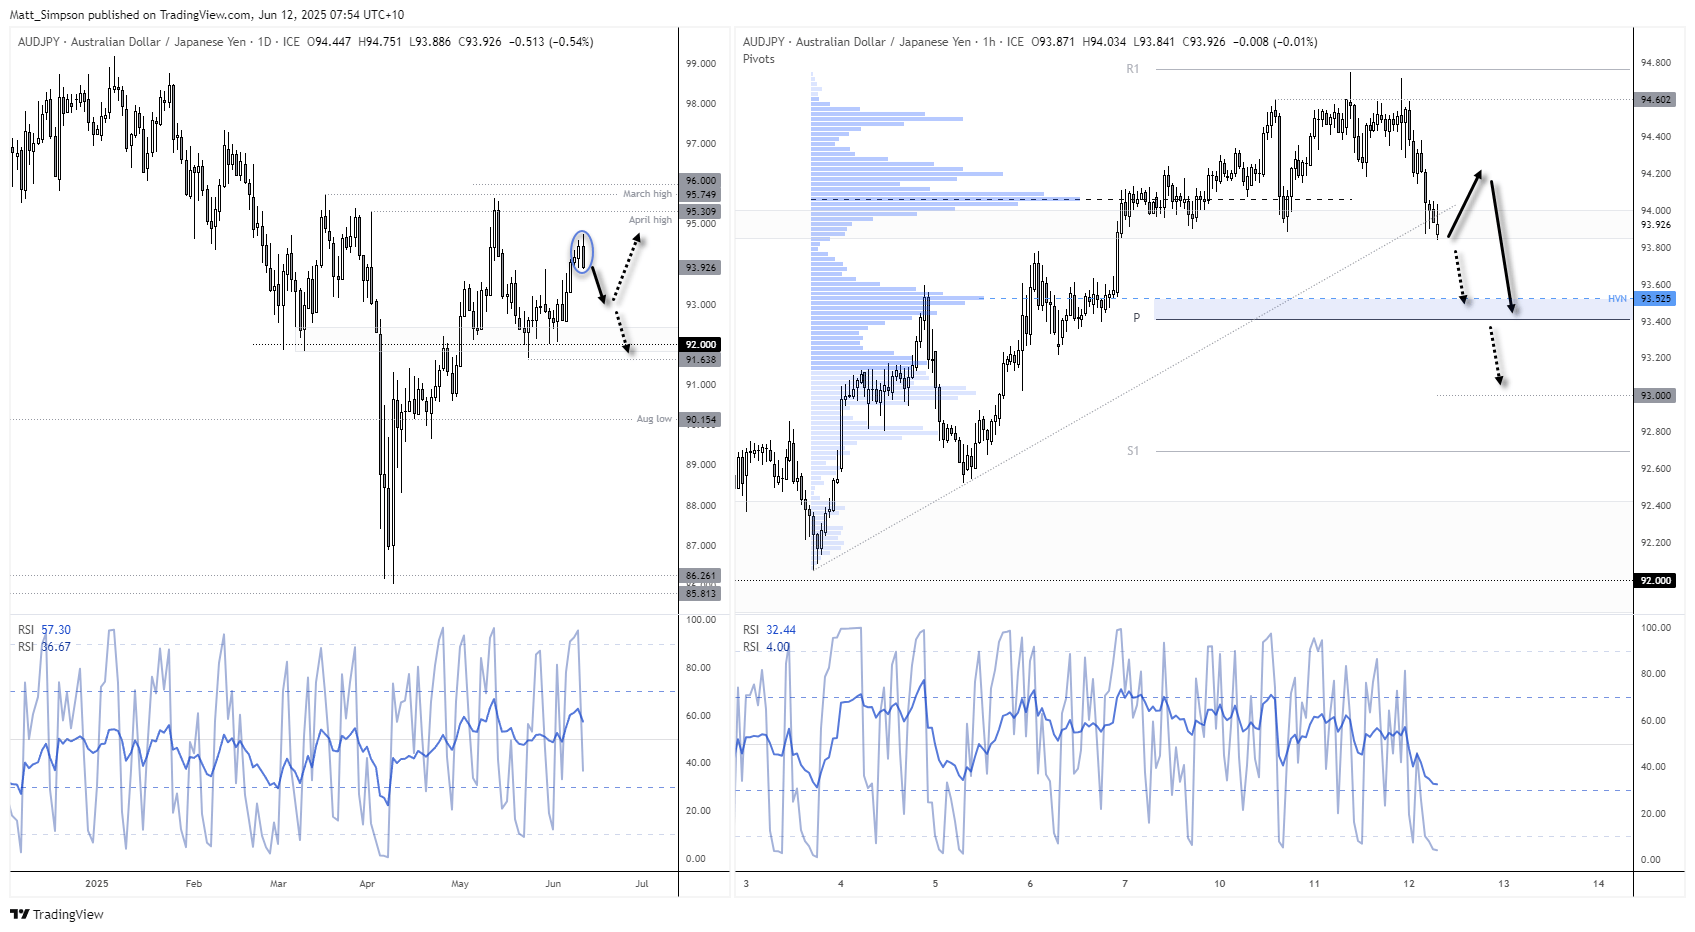
I had expected AUD/JPY to continue higher in the face of persistent Japanese yen weakness. Clearly, that has not been the case, with AUD/JPY forming a bearish engulfing candle on Wednesday — a clear signal that the Australian dollar may be losing momentum against the yen. As such, I’m inclined to be on guard for a deeper pullback heading into the weekend, unless a bout of risk-on sentiment revives demand for the Aussie.
The 1-hour chart shows the bullish trendline from the 3 June low is already under pressure. Given price is meandering around this trendline during low liquidity conditions, some patience is warranted — we could see choppy price action around this area. Still, the bearish engulfing candle keeps the bias tilted lower, and my preference is to fade minor rebounds off the trendline or watch for evidence of an intraday swing high within Wednesday’s range.
The monthly pivot point at 93.40 and a nearby high-volume node (HVN) at 93.53 form an immediate support zone for AUD/JPY bears. A break beneath this area could bring the 93.00 handle into focus, especially if risk sentiment deteriorates further.
EUR/AUD Technical Analysis: Euro vs Australian Dollar
EUR/AUD posted its strongest daily gain in three weeks on Wednesday, rising 0.8% and closing firmly above the 1.76 handle. This move represents a clear bullish range expansion from Tuesday’s narrow Doji candle and saw the euro dollar use the 50-day EMA as a launchpad. It also revives a previously stated bullish outlook for EUR/AUD, with upside potential towards 1.80 against the Australian dollar.
Still, the 50-day simple moving average (SMA) capped the day’s advance, suggesting that an intraday pullback could be in play while prices remain beneath the 1.77 resistance level. The 4-hour RSI (2) is deeply overbought, and the RSI (14) is approaching its overbought zone. Traders bullish on the euro dollar may look to fade pullbacks in EUR/AUD towards the 1.7586 high-volume node (HVN) or the 1.7500 support level.
Should a swing low materialise, potential upside targets for EUR/AUD include the weekly and monthly VPOCs (volume points of control) around 1.7750, 1.7820, and 1.7950.
Economic Events in Focus (AEST / GMT+10)
- 08:45: NZD Electronic Card Retail Sales (May) (NZD/USD, AUD/NZD)
- 09:50: JPY BSI Large Manufacturing Conditions, Foreign Investment Flows (USD/JPY, EUR/JPY, Nikkei 225)
- 11:00: AUD MI Inflation Expectations (Jun) (AUD/USD, ASX 200)
- 16:00: GBP GDP, Trade Balance, Industrial & Manufacturing Production (Apr) (GBP/USD, FTSE 100)
- 19:00: EUR ECB's Schnabel Speaks (EUR/USD, EUR/GBP)
- 20:00: GBP Thomson Reuters IPSOS PCSI (Jun) (GBP/USD)
- 21:00: GBP NIESR Monthly GDP Tracker (May) (GBP/USD)
- 22:00: EUR German Current Account, ECB’s De Guindos & Schnabel Speeches (EUR/USD, DAX)
- 22:30: USD PPI, Core PPI, Jobless Claims (May) (USD, Gold, S&P 500, Nasdaq 100, Dow Jones)
- 00:15: EUR ECB’s Elderson Speaks (EUR/USD)
- 00:30: USD Natural Gas Storage (WTI Crude Oil, Natural Gas, USD)
- 01:00: USD Cleveland CPI (May) (USD)
- 02:00: USD WASDE Report (USD, Corn, Wheat, Soybeans)
- 03:00: USD 30-Year Bond Auction (USD, US Treasury Bonds)
- 04:00: USD 10-Year Note Auction (USD, US Treasury Bonds)
- 06:30: USD Fed Balance Sheet, Reserve Balances (USD)
View the full economic calendar
View the full economic calendar
-- Written by Matt Simpson
Follow Matt on Twitter @cLeverEdge
How to trade with City Index
You can trade with City Index by following these four easy steps:
- Open an account, or log in if you’re already a customer
• Open an account in the UK
• Open an account in Australia
• Open an account in Singapore
- Search for the market you want to trade in our award-winning platform
- Choose your position and size, and your stop and limit levels
- Place the trade
Related tags:
Latest market news




The complete CFD trading experience
Award-winning platforms, competitive spreads, low commissions and dedicated support.
We live and breathe the markets and are dedicated to helping traders realise their ambitions as we continue to set the industry bar.
Economic calendar
Web Trader platform
Our sophisticated web-based platform is packed with features.
Related articles
US dollar outlook: Nasdaq breakdown raises stakes for EUR/USD, USD/JPY
A potential Democratic sweep of Congress is adding to the AI trade's headaches, with Nasdaq 100 futures breaking below a major technical level. The implications for the dollar could be significant.
US Dollar Short-term Outlook: USD Rally on the Line as Midterms, NFP Loom 11 3 2026
DXY is testing pivotal support, with the weekly range breakout likely to determine the next major leg of the trend as key event risk unfolds.

Nasdaq 100 forecast: Stocks rebound but AI concerns linger
The Nasdaq 100 was finding some support at 28,000 after recent sell-off amid concerns about the AI trade. Even with oscillators oversold, the risk to the near-term forecast is tilted to the downside.

StoneX Europe Ltd may make third party material available on this website which may contain information included but not limited to the conditions of financial markets. The material is for information purposes only and does not contain, and should not be construed as containing, investment advice and/or investment recommendation and/or an investment research and/or an offer of or solicitation for any transactions in financial instruments; any decision to enter into a specific transaction shall be made by the client following an assessment by him/her of their situation.
StoneX Europe Ltd makes no representation or warranty and assumes no liability as to the accuracy or completeness of the information provided, nor any loss arising from any investment based on a recommendation, forecast or other information supplied. You should always seek independent advice as to your suitability to speculate in any related markets and your ability to assume the associated risks, if you are at all unsure. We are not under any obligation to update any such material. Any opinion made may be personal to the author and may not reflect the opinion of StoneX Europe Ltd.