









AUD/USD Outlook: Headwinds from China Data and RBA Policy
65c continues to defy AUD/USD of a bullish breakout. Inflation data from China and the US are key data points for Australian dollar traders to keep an eye on this week.
Share this:

The Australian dollar remains vulnerable this week as fresh signs of deflation from China and soft Q1 GDP data fuel expectations of a July rate cut from the Reserve Bank of Australia (RBA). With AUD/USD repeatedly failing to hold above 65c, traders now turn their focus to upcoming US inflation figures for clues on the Federal Reserve’s next move. Together, these macro forces are keeping the Aussie trapped within a familiar range — and tipping the balance toward downside risks.
AUD/USD Outlook: Headwinds from China Data and RBA Policy
The Reserve Bank of Australia Look Set to Cut In July
Australia’s sluggish growth in Q1 has likely cemented another 25bp cut from the RBA on July 4. Barring an upside surprise from monthly CPI report on June 25.
- Real GDP rose just 0.2% q/q (0.6% prior) and remained steady at 1.3% y/y.
- Consumption was also a mere 0.2% (0.5% prior)
- Manufacturing and services PMIs were barely expansionary
- Retail sales were also sluggish in May
- Odds of an RBA cut in July have risen to 86%, according to the RBA cash rate futures
AUD/USD Vulnerable as China Inflation Data Points to Deflation
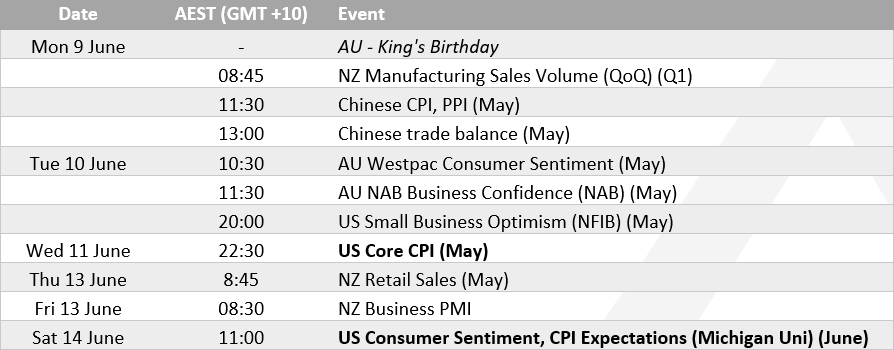
There’s lots of talk about deflation in China. If true, it points to softer global growth and deflation (to at least disinflation elsewhere). Which is a far cry from the highly inflationary environment we were promised due to Trump’s tariffs. China release CPI and PPI figures on Monday, with inflation expected to have contracted -0.2% in May (-0.1% prior) and producer prices to have sunk -3.1% y/y in May (-2.7% y/y prior). This could weigh on AUD/USD if this trend persists. Even if not, it is hard to see how it is bullish for the Australian dollar.
US inflation is the main economic event this week
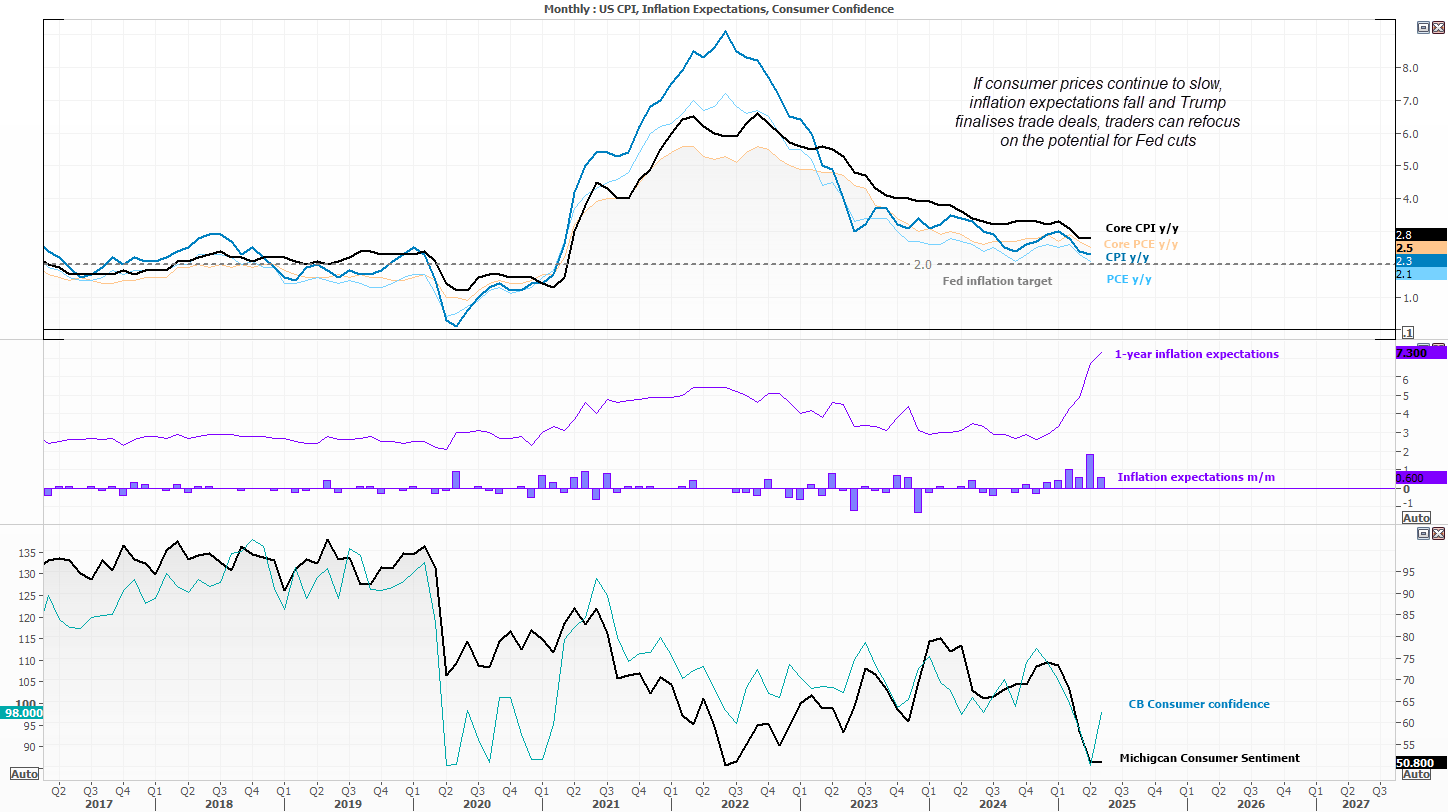
Trump’s tariffs have not proven as inflationary as many had feared, with the latest core PCE price index rising just 0.1% in May — marking a three-year low of 2.5% y/y and reflecting sluggish consumer spending. If President Trump manages to secure trade deals and draw a line under the trade war, recession concerns may ease considerably. That would allow traders to refocus on Federal Reserve policy. A softer US CPI report this week could bolster expectations for a Fed rate cut.
The University of Michigan consumer sentiment report is likely to show a rebound on Friday, though form very low levels. The Conference Board’s own sentiment report snapped a 5-month losing streak in May, with its 12.3 m/m increase being its fastest in over three years.
AUD/USD correlations:
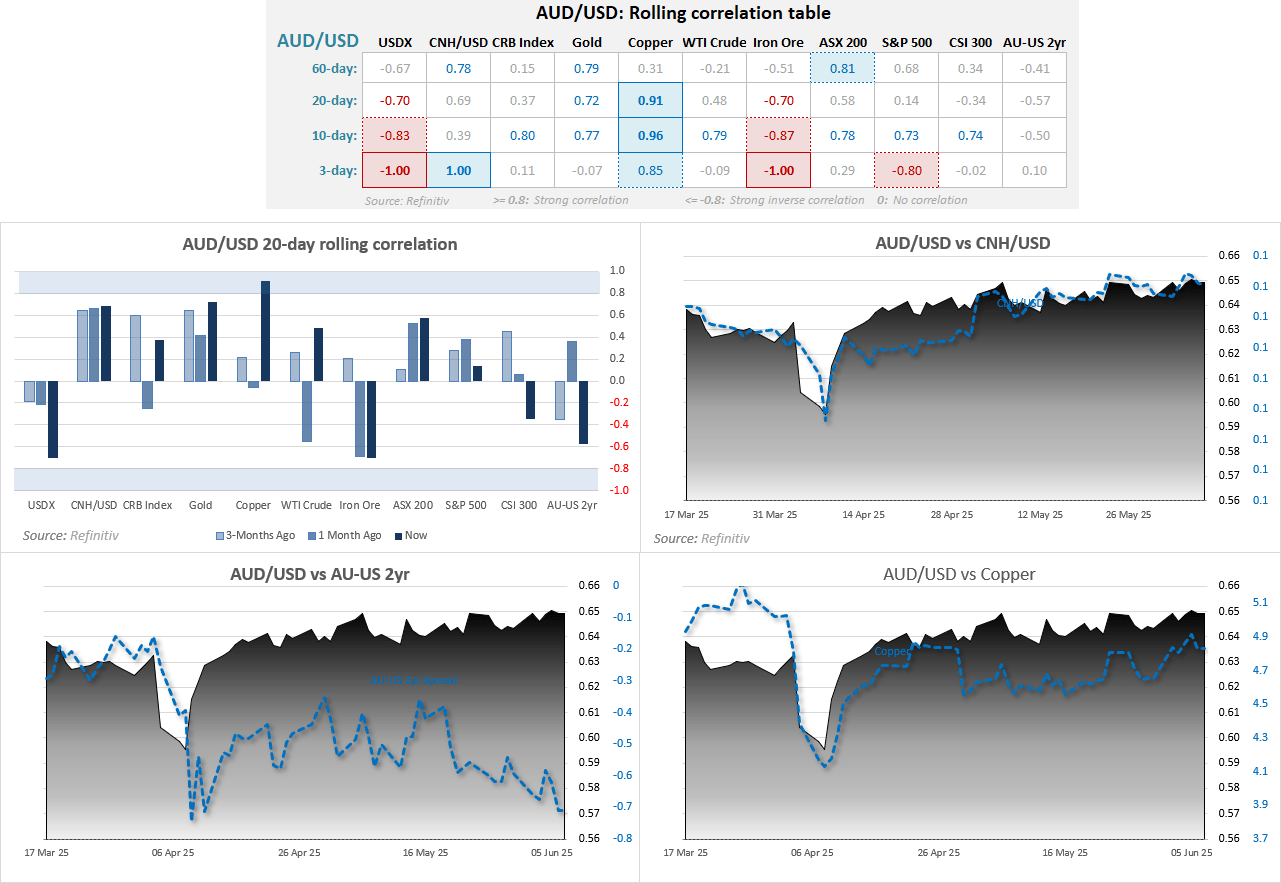
- The correlation between the Australian dollar and Chinese yuan is losing its potency, with the 10-day correlation slipping to 0.39 (1.0 = perfect correlation, -1.0 = perfect inverse).
- However, it remains robust over the 60-day period at 0.78.
- The broader trend between AUD/USD and CNH/USD still looks visually strong, with USD/CNH finding support at 7.164 and the Aussie once again pulling back from the 65c level.
- The positive correlation between copper and AUD/USD that we noted last week remains intact, but the relationship with gold has seemingly broken down for now.
- The correlation between yield differential between the US and Australia have continued to diminish.
AUD/USD Futures – Market Positioning From The COT Report:
- Once again, week-over-week changes to AUD/USD net-short exposure have been minimal and borderline insignificant.
- Large speculators increased net-short exposure by approximately 2,000 contracts, while asset managers trimmed theirs by just 340 contracts.
- Both groups increased gross long and short positions, so although volumes ticked higher, it offers no clear directional bias.
- This aligns with price action, which remains trapped within the familiar 0.64–0.65 range.
AUD/USD Technical Analysis
The Australian dollar has spent most of the past two weeks consolidating within the 0.64–0.65 range. While daily momentum has edged higher over the past week, yet another false intraday break above 65c was met with a bearish reversal candle — classic hallmarks of a “sucker punch” for AUD/USD bulls.
More importantly, the US dollar appears poised for a bounce, while USD/CNH continues to hold above key support at the October high (7.1640). It’s difficult to envision a sustainable breakout above 65c for AUD/USD while the Chinese yuan remains firm at that level.
Unless this backdrop shifts, the preference remains to fade rallies toward 65c and seek dips closer to 64c. It may not be glamorous, but so far, it’s been working.
-- Written by Matt Simpson
Follow Matt on Twitter @cLeverEdge
How to trade with City Index
You can trade with City Index by following these four easy steps:
- Open an account, or log in if you’re already a customer
• Open an account in the UK
• Open an account in Australia
• Open an account in Singapore
- Search for the market you want to trade in our award-winning platform
- Choose your position and size, and your stop and limit levels
- Place the trade




The complete CFD trading experience
Award-winning platforms, competitive spreads, low commissions and dedicated support.
We live and breathe the markets and are dedicated to helping traders realise their ambitions as we continue to set the industry bar.
Economic calendar
Web Trader platform
Our sophisticated web-based platform is packed with features.
Related articles

EUR/USD weekly outlook: Oil, inflation and NFP in focus
After coming under significant pressure in recent weeks, the EUR/USD came off its lows to finish the week on a positive note on Friday, albeit with only a mild rebound. That was not enough to prevent the exchange rate falling for the third consecutive week, as the US dollar and bond yields rallied across the board.


USD/JPY Weekly Outlook: Payrolls loom as US rates remain the dominant driver
Strong US growth and hawkish Fed pricing continue to support USD/JPY, while intervention risk appears to be kicking in at lower levels


EUR/USD Q4 2026 Outlook: Euro at a Crossroads as Fed, ECB Tighten 9 25 2026
EUR/USD enters Q4 at a pivotal inflection point as competing Fed-ECB policy paths and persistent inflation risks collide with major technical support.

StoneX Europe Ltd may make third party material available on this website which may contain information included but not limited to the conditions of financial markets. The material is for information purposes only and does not contain, and should not be construed as containing, investment advice and/or investment recommendation and/or an investment research and/or an offer of or solicitation for any transactions in financial instruments; any decision to enter into a specific transaction shall be made by the client following an assessment by him/her of their situation.
StoneX Europe Ltd makes no representation or warranty and assumes no liability as to the accuracy or completeness of the information provided, nor any loss arising from any investment based on a recommendation, forecast or other information supplied. You should always seek independent advice as to your suitability to speculate in any related markets and your ability to assume the associated risks, if you are at all unsure. We are not under any obligation to update any such material. Any opinion made may be personal to the author and may not reflect the opinion of StoneX Europe Ltd.