



AUD/USD, AUD/CAD Analysis: Hawkish BOC hike concerns doves
The Bank of Canada’s (BOC) hawkish hike weighed on sentiment as it rekindled some concerns that central banks are not as close to their terminal rates as originally thought.
Share this:

The Bank of Canada’s (BOC) hawkish hike weighed on sentiment as it rekindled some concerns that central banks are not as close to their terminal rates as originally thought. And those concerns are not so far-fetched, given the RBA caught the consensus off guard with a hike earlier this week. Yields were higher alongside the US dollar as Fed fund futures slightly increased the odds of a hike at next week’s FOMC, although they continue to favour a pause with a 66.2% probability.
Having read through the statement, I’m now struck by how hawkish it is and that further hikes cannot be ruled out. Demand for services has increased, growth was stronger than expected, labour market remains tight, inflation remains elevated and “concerns have increased that CPI could get stuck materially above the 2% target”.
Notes from the BOC monetary policy statement, June 20023
- The overnight cash rate was increased by 25bp to 4.75%
- Global inflation is coming down but remains stubbornly high
- Major central banks are signalling that interest rates may have to rise further to restore price stability
- Canada’s economy was stronger than expected in the first quarter
- Consumption growth was surprisingly strong and broad-based
- Demand for services continued to rebound, spending on interest-sensitive goods increased, housing market activity has picked up
- The labour market remains tight
- …excess demand in the economy looks to be more persistent than anticipated
- Goods price inflation increased and Services CPI remained elevated
- …concerns have increased that CPI inflation could get stuck materially above the 2% target
- …monetary policy was not sufficiently restrictive
And if the BOC could hike further, so could other central banks. And those concerns were enough to weigh on gold and drag tech sharply lower from their highs. USD/CAD fell to a 4-week low but recouped around half the days earlier losses, with traders keep an eye on two cycle lows above the 1.33 handle. CAD/JPY extended its bullish trend in line with yesterday’s bias and bulls are now considering a break above the 105 handle. A firmer US dollar and weak GDP report for Australian also weakened the AUD/USD which snapped a 5-day rally.
Weak GDP reports also weighed on AUD/USD
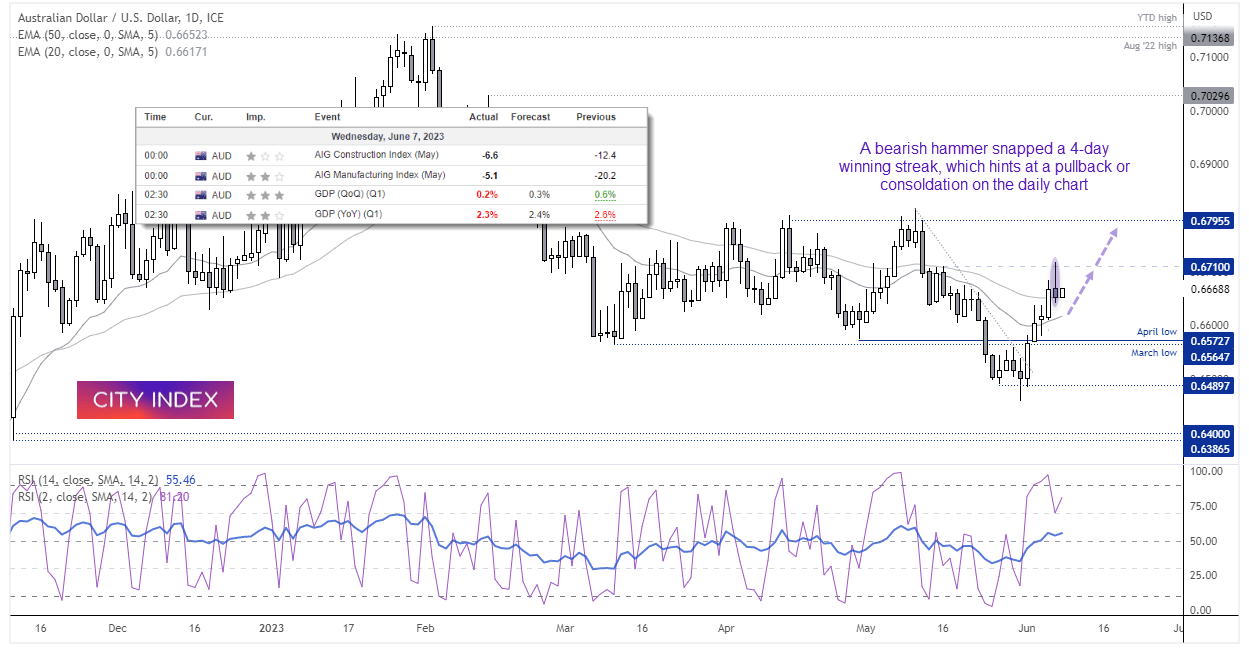

GDP rose just 0.2% q/q, down from 0.6% and below 0.3% expected. Whilst the annual rate fell to 2.3% y/y below the 2.4% expected and Q4 was revised down to 2.6% from 2.7%. The upside to weaker growth is lower inflation, but the downside is clearly... lower growth. Construction and manufacturing PMIs also contracted in May according to an AIG report, and the increased odds of central bank tightening elsewhere ultimately overshadowed hawkish comments made earlier by RBA governor Philip Lowe.
AUD/USD snapped a 4-day rally and printed a bearish hammer on the daily chart, the high of which met resistance around the 0.67100 level before prices pulled back. It now trades away the midway point of the 0.6570 – 0.6950 range, and prices appear set to either consolidate around current levels or pull back slightly before its next anticipated leg higher. The RSI (14) is above 50 and we suspect large speculators (who remained net-short last week) are still looking to cover some shorts to support higher prices.
AUD/USD 1-hour chart
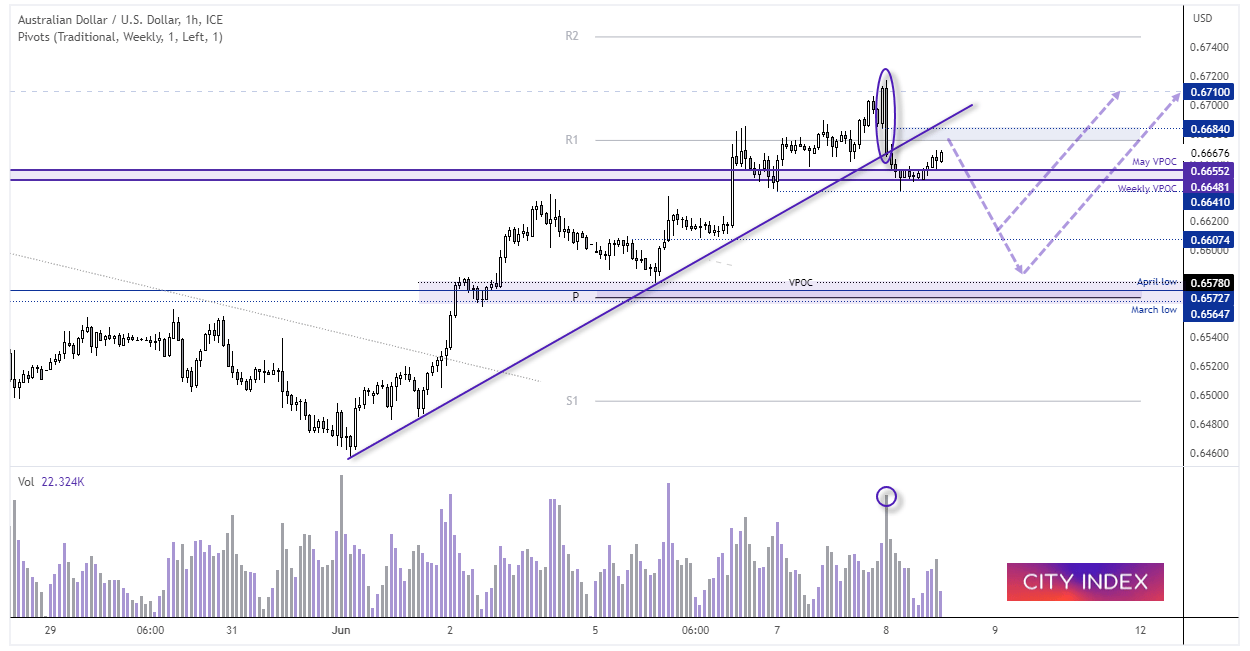

Prices broke beneath a bullish trendline on the 4-hour chart, and an enlarged bearish engulfing candle on high volume. Support was fond around a historical volume cluster and prices are now retracing higher on low volume, which suggest the mediocre rise to be a retracement. From here, we’re seeking evidence of a swing high up to 0.6684, where a subsequent break below 0.6640 assumes a pullback towards 0.6600 (with the next zone of support sitting around 0.6570).
AUD/CAD daily chart:
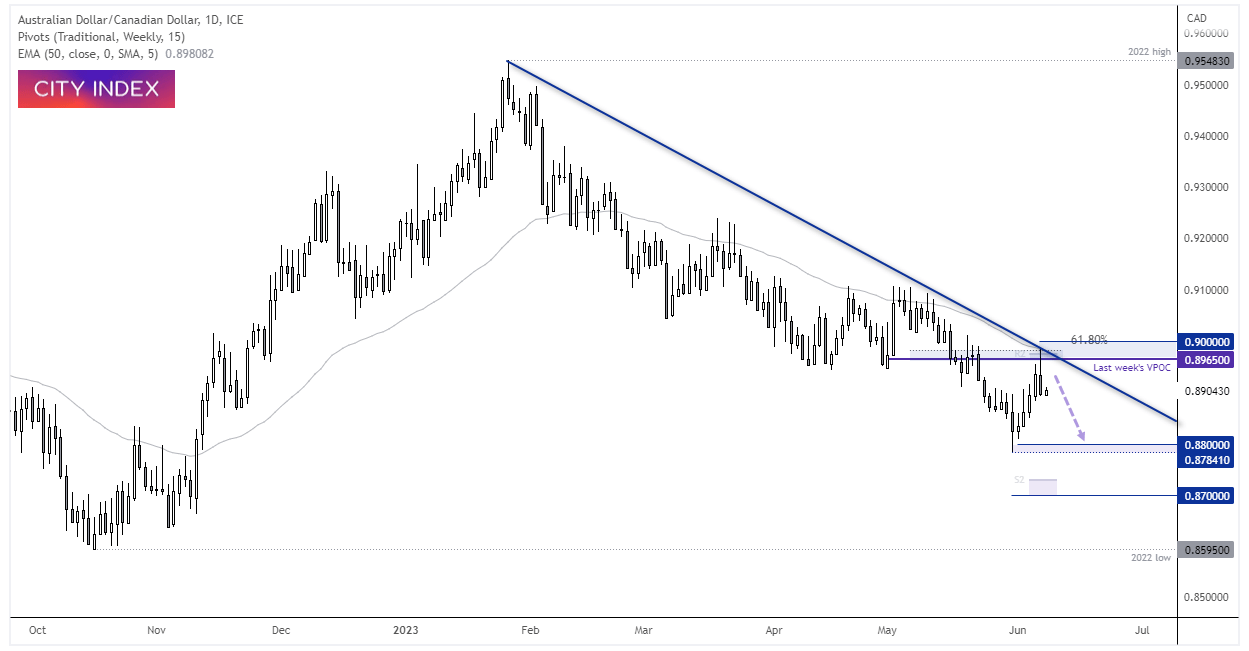

Whilst the RBA or BOC both wield the potential to hike further, the BOC retains its 65bp yield differential which helps explain the downtrend which has formed on the daily chart this year. We also note that a bearish reversal candle has formed at an interesting resistance zone just beneath the 0.90 handle, which comprises of the 50-day EMA, 61.8% Fibonacci retracement level, last week’s VPOC and the weekly R2 pivot. We suspect a swing high has formed and momentum could potentially revert lower, with the initial target for bears to consider being the lows around 0.8800.
-- Written by Matt Simpson
Follow Matt on Twitter @cLeverEdge
How to trade with City Index
You can trade with City Index by following these four easy steps:
- Open an account, or log in if you’re already a customer
• Open an account in the UK
• Open an account in Australia
• Open an account in Singapore
- Search for the market you want to trade in our award-winning platform
- Choose your position and size, and your stop and limit levels
- Place the trade
Related tags:
Latest market news




The complete CFD trading experience
Award-winning platforms, competitive spreads, low commissions and dedicated support.
We live and breathe the markets and are dedicated to helping traders realise their ambitions as we continue to set the industry bar.
Economic calendar
Web Trader platform
Our sophisticated web-based platform is packed with features.
Related articles
USD/CAD and USD/MXN Q4 2026 Outlook: Will the U.S. Dollar Dominate North America Again?
The final stretch of 2026 is approaching, and North America's major currencies have begun to show a shift in the strength dynamics seen earlier in the year. New expectations of a more aggressive monetary policy stance, particularly in the United States, could be significantly reshaping the outlook for the region. At the same time, this backdrop, combined with potential trade tensions across North America, may become one of the most important drivers of currency performance in the months ahead.


Oil Quietly Hands the Fed a Reason to Stay Hawkish
Oil prices and the U.S. dollar are both on the front foot as elevated energy costs feed Fed warnings that inflation may prove sticky.


S&P 500 forecast: Stocks extend drop as correction risks grow
US and global equity markets have extended Wednesday’s sell-off, with Wall Street opening lower after a weak handover from Asia and Europe. The deterioration in risk appetite has been spreading across global markets. The dollar was firmer, Treasury yields were holding onto yesterday’s gains, while gold, silver and bitcoin were all under pressure alongside equities and major currencies.
StoneX Europe Ltd may make third party material available on this website which may contain information included but not limited to the conditions of financial markets. The material is for information purposes only and does not contain, and should not be construed as containing, investment advice and/or investment recommendation and/or an investment research and/or an offer of or solicitation for any transactions in financial instruments; any decision to enter into a specific transaction shall be made by the client following an assessment by him/her of their situation.
StoneX Europe Ltd makes no representation or warranty and assumes no liability as to the accuracy or completeness of the information provided, nor any loss arising from any investment based on a recommendation, forecast or other information supplied. You should always seek independent advice as to your suitability to speculate in any related markets and your ability to assume the associated risks, if you are at all unsure. We are not under any obligation to update any such material. Any opinion made may be personal to the author and may not reflect the opinion of StoneX Europe Ltd.