










AUD/USD, USD/CAD, NZD/USD: An Engulfing Day for Commodity FX
Commodity currencies stumble after bearish engulfing signals on AUD/USD, NZD/USD, and USD/CAD. As the Fed holds rates and trade talks loom, the US dollar regains strength.
Share this:

Fed Holds Rates Steady and Signals Constraints on Policy Easing
There were no surprises in this week’s FOMC meeting—in fact, it went exactly as I expected. The Federal Reserve (Fed) kept policy unchanged and came across as less dovish than before. That’s not to say they were hawkish, but their reference to growing risks to both sides of their dual mandate—rising unemployment and persistent inflation—highlights just how constrained they are when it comes to rate cuts. There’s no talk of hikes yet, but if Trump’s trade war eventually justifies them, the Fed will need to signal it well in advance. With markets still trying to price in cuts, the Fed is likely to remain ‘less dovish’ than markets anticipate for now.
View related analysis:
- USD/JPY, USD/CHF, EUR/USD Analysis: USD Reversal Grinds Away
- EUR/AUD Analysis: April’s Candle is Eerily Similar to 2008, 2020 Highs
- Japanese Yen Technical Outlook: AUD/JPY Leads the Risk-on Pack
- Japanese Yen Bulls Still Pushing Their Luck: COT Report
View related analysis:
- USD/JPY, USD/CHF, EUR/USD Analysis: USD Reversal Grinds Away
- EUR/AUD Analysis: April’s Candle is Eerily Similar to 2008, 2020 Highs
- Japanese Yen Technical Outlook: AUD/JPY Leads the Risk-on Pack
- Japanese Yen Bulls Still Pushing Their Luck: COT Report
Markets Pin Hopes on US–China Trade Talks to Lift Sentiment
Still, there are hopes that the US and China can hold constructive talks this weekend and lay the groundwork for trade deals. Trump has already suggested he intends to lower tariffs on China, but just by how much—and what China needs to offer in return—remains to be seen. So there’s a glimmer of hope in the air heading into the weekend, which could make or break sentiment come Monday once traders have seen the headlines.

US Dollar Gains as Bearish Reversals Emerge in Commodity FX and GBP/USD
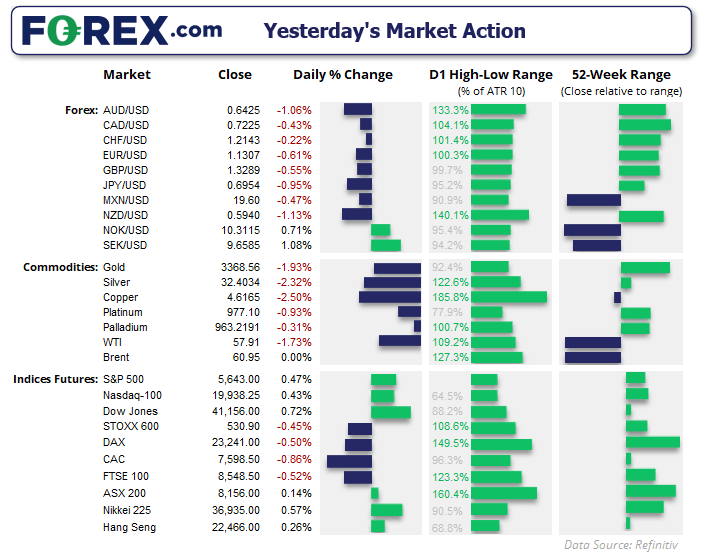
The US dollar was the strongest major currency on Wednesday, buoyed by a less-dovish Fed, while commodity currencies—AUD, NZD, and CAD—were dragged lower alongside gold and oil. What’s particularly striking about the commodity FX space is that all three produced bearish engulfing candles on Wednesday, reinforcing my well-established view that their recent rallies are due for a pullback.
Elsewhere, GBP/USD formed a two-bar bearish reversal pattern known as a Dark Cloud Cover, which suggests we may have seen the formation of the ‘right shoulder’ in a head and shoulders top on the daily chart—just ahead of today’s Bank of England (BOE) meeting.
AUD/USD Technical Analysis: Australian Dollar vs US Dollar
A bearish engulfing candle formed on AUD/USD on Wednesday, marking its most bearish session since April 4. That it occurred alongside a false break above the 0.65 handle, a daily close beneath the 200-day SMA (simple moving average), and a bearish RSI (2) divergence further supports the case for a pullback. I’m not expecting anything significant here, but a retracement towards the April VPOC (volume point of control) at 0.6370 seems feasible—and could be reached within one to two trading days, based on recent volatility.
Bears could look to enter on retracements towards the 200-day SMA at 0.6455 in anticipation of a further leg lower.
I'm also assuming that the Chinese yuan will continue to strengthen heading into the weekend, which may weigh further on AUD/USD. A break beneath the 0.6344 low would spell trouble for Aussie bulls.
NZD/USD Technical Analysis: New Zealand Dollar vs US Dollar
A bearish engulfing day formed on NZD/USD, which also confirmed a lower high beneath the recent peak. The price action could also be interpreted as a double top forming just below the November high, accompanied by a bearish RSI (2) divergence.
An ABC corrective pattern may also be unfolding. Wave equality (A = C) projects a target around the 200-day SMA and the 0.5894 low, while a 161.8% Fibonacci extension suggests that wave C could extend just above the 0.58 handle.
USD/CAD Technical Analysis: US Dollar vs Canadian Dollar
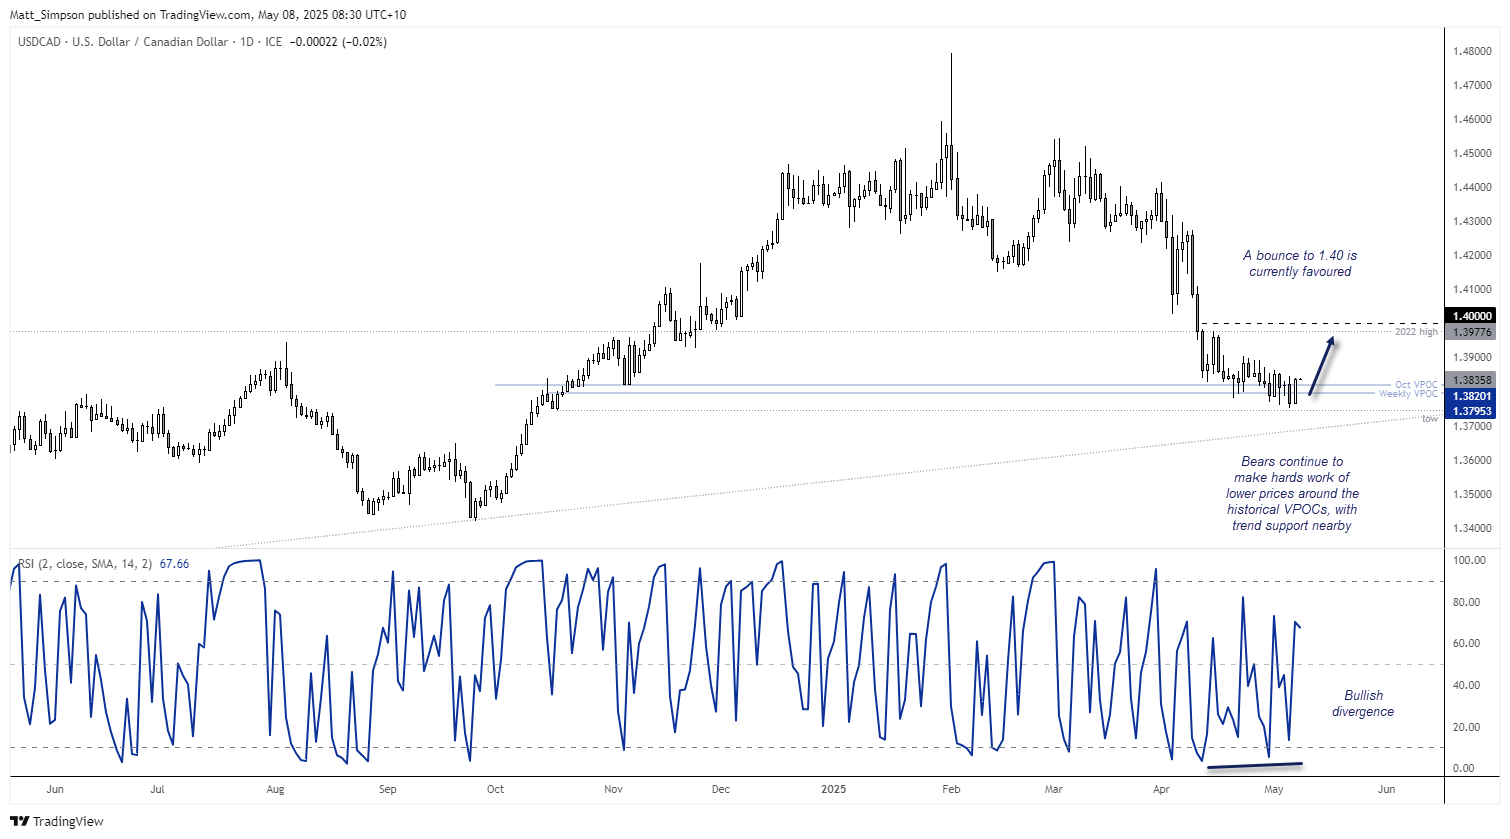
I have repeatedly highlighted the potential for a bullish reversal on the Canadian dollar (USD/CAD), and I believe we are as close as ever to one. Bearish momentum has clearly been waning on USD/CAD the past couple of weeks as bears make hard work of lower prices around the October and weekly VPOC. A bullish divergence ha also been forming.
The bias is simply for a move up to 1.40. Whether it gets there or beyond is once again down to Trump’s tariffs.
GBP/USD Technical Analysis: British Pound vs US Dollar
A potential head and shoulders (H&S) top is forming on the GBP/USD daily chart, which could be confirmed by a break beneath the neckline or the 1.3260 low. The pattern projects a target around 1.3080, although there are potential support levels to watch along the way—namely around the 1.3200 high and the monthly pivot point at 1.3158.
The H&S pattern would stand a much greater chance of success if the Bank of England (BOE) strikes a more dovish tone later today and if US–China trade talks conclude positively. That said, I’ve observed that few H&S patterns on the daily chart have reached their traditional measured targets in recent times. I see the potential for at least a move to 1.3200, but how far GBP/USD can fall from here really depends on the strength of the US dollar, particularly in relation to developments in Trump’s trade war.
Economic Events in Focus (AEST / GMT+10)
- 09:50 – BOJ monetary policy minutes
- 13:35 – Japanese 10year JGB auction
- 16:00 – German Industrial Production (MoM) (Mar)
- 21:00 - BoE Interest Rate Decision (-25bp cut expected)
- 23:30 – US Jobless Claims
- 23:15 – BOE Governor Bailey Speaks
-- Written by Matt Simpson
Follow Matt on Twitter @cLeverEdge
How to trade with City Index
You can trade with City Index by following these four easy steps:
- Open an account, or log in if you’re already a customer
• Open an account in the UK
• Open an account in Australia
• Open an account in Singapore
- Search for the market you want to trade in our award-winning platform
- Choose your position and size, and your stop and limit levels
- Place the trade
Latest market news




The complete CFD trading experience
Award-winning platforms, competitive spreads, low commissions and dedicated support.
We live and breathe the markets and are dedicated to helping traders realise their ambitions as we continue to set the industry bar.
Economic calendar
Web Trader platform
Our sophisticated web-based platform is packed with features.
Related articles
USD/CAD reversal risk builds as central bank showdown looms
USD/CAD has delivered a bullish reversal signal from established support, just as traders prepare for Fed and BoC decisions. Aggressive Canadian rate hike expectations and conflicting momentum signals make the coming session important.
EUR/USD weekly outlook: FOMC and ECB to set the tone
The current backdrop is modestly bearish. On Friday, the EUR/USD closed modestly lower, down for the third consecutive day. The pair also posted a weekly decline after staging a modest recovery attempt in the previous week. Out of the past 8 weeks, the EUR/USD has fallen on 6 occasions. There is not much supporting factors for the single currency right now. So, the upside remains capped.


USD/JPY Forecast: Is Rising Japanese Inflation Supporting the Yen?
As the trading week comes to an end, one of the most relevant developments in the FX market has been the renewed strength of the Japanese yen. This can be seen in the recent performance of USD/JPY, which has fallen nearly 1.0% over the last two trading sessions, highlighting a meaningful recovery in the Japanese currency against the U.S. dollar.

StoneX Europe Ltd may make third party material available on this website which may contain information included but not limited to the conditions of financial markets. The material is for information purposes only and does not contain, and should not be construed as containing, investment advice and/or investment recommendation and/or an investment research and/or an offer of or solicitation for any transactions in financial instruments; any decision to enter into a specific transaction shall be made by the client following an assessment by him/her of their situation.
StoneX Europe Ltd makes no representation or warranty and assumes no liability as to the accuracy or completeness of the information provided, nor any loss arising from any investment based on a recommendation, forecast or other information supplied. You should always seek independent advice as to your suitability to speculate in any related markets and your ability to assume the associated risks, if you are at all unsure. We are not under any obligation to update any such material. Any opinion made may be personal to the author and may not reflect the opinion of StoneX Europe Ltd.