



Australian Dollar Outlook: AUD/USD, AUD/JPY and AUD/NZD Setups
AUD/USD, AUD/JPY and AUD/NZD react to stronger risk sentiment, with major resistance levels likely to determine the Australian dollar's next move.
Share this:

Improving risk sentiment helped lift the Australian dollar after easing Middle East tensions and stronger US economic data. While AUD/USD, AUD/JPY and AUD/NZD all advanced, each cross is approaching important technical levels that could determine whether the rally extends or fades.
View related analysis:
View related analysis:
Risk Sentiment Drives the Australian Dollar Higher
Middle East Optimism Lifts Global Risk Sentiment
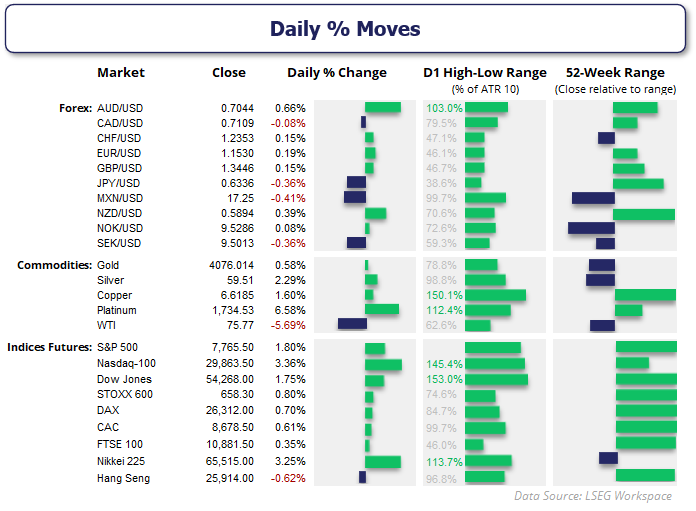
Prospects that the Strait of Hormuz could reopen boosted risk appetite on Tuesday, lifting Wall Street sentiment. ISM manufacturing PMI also edged higher to 55.6 from 53.3. Employment expanded, new orders ticked higher and prices paid ticked lower, albeit from elevated levels. The S&P 500 and Dow Jones reached record highs, while the Nasdaq closed in on 30,000. The SPI 200 rose 0.4% overnight, which should see the ASX 200 gap higher and place its all-time high within a day's typical trading range.
Antipodeans Lead as Yen Lags
AUD/USD and NZD/USD were the strongest FX majors as the antipodeans embraced the positive lead from the Middle East headlines. Whether that proves to be another false start, however, risks reversing that sentiment. The Japanese yen was the weakest FX major, although its losses were marginal as traders likely remained wary of betting against the combined might of the MOF and the Fed. USD/JPY edged higher in line with yesterday's bias, although resistance emerged around the first zone, which includes the 200-day moving averages near 157.80. I suspect bears are seeking evidence of swing highs around resistance levels, with 158.00, 159.00 and 159.40 the main contenders.
Source: LSEG
Australian Dollar Technical Setups
AUD/USD Presses Against Key Resistance
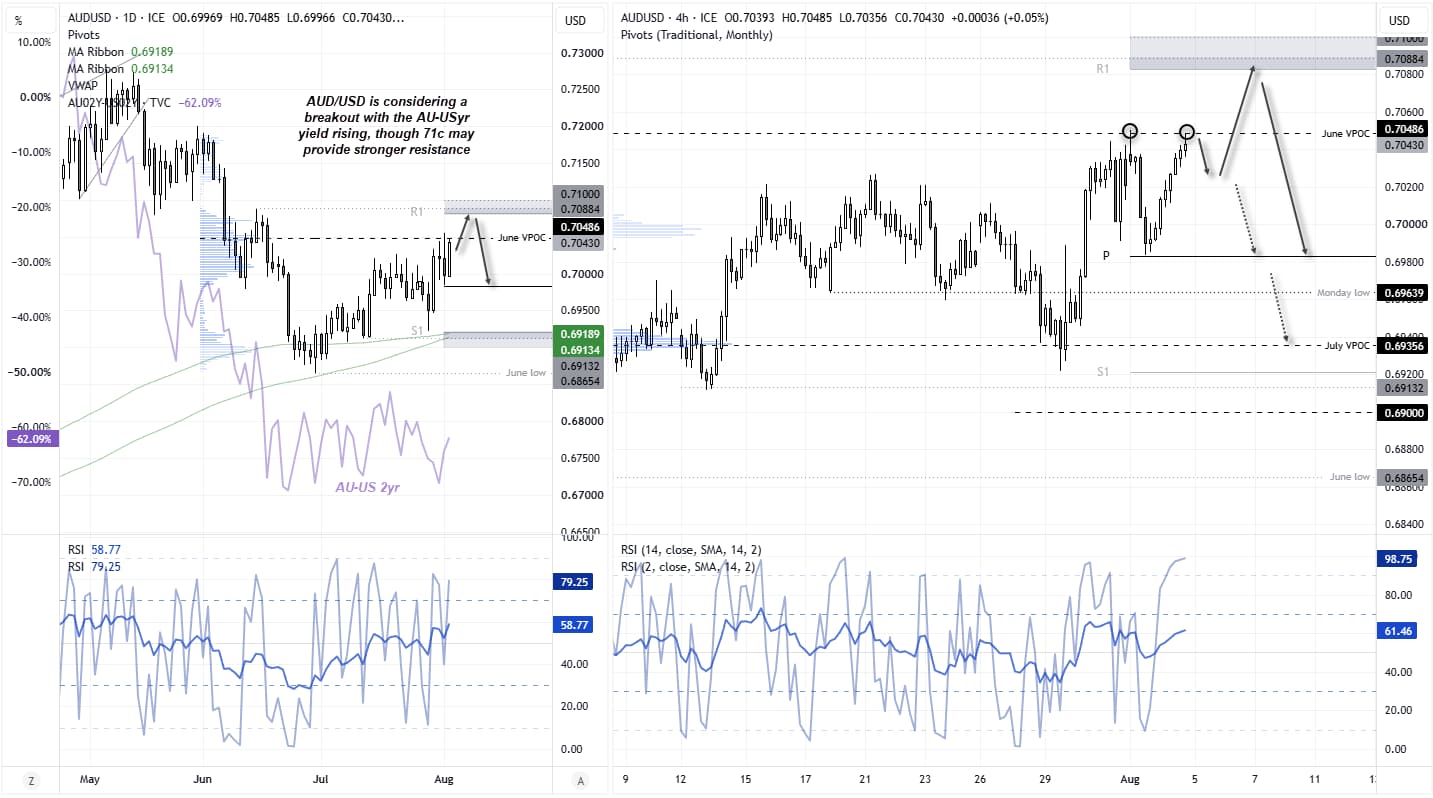
The Aussie has so far held up well against the US dollar's mild bullish retracement. Given the AU-US two-year yield spread has risen so far this week, perhaps a breakout is on the cards in the near term. For now, AUD/USD continues to respect the June VPOC as resistance, and even if bulls break above it, they still have the monthly R1 pivot point and the June 15 high to contend with. A break above 0.7100 could provide the first real test of this risk-on rally.
For now, however, my bias remains for a swing high to form and for AUD/USD to snap its four-week winning streak. The RBA seems unlikely to hike again this cycle, while futures traders continue to increase their bearish bets against the Australian dollar, according to recent Commitment of Traders (COT) data.
Source: ICE, TradingView


AUD/JPY Bounce Faces Heavy Resistance
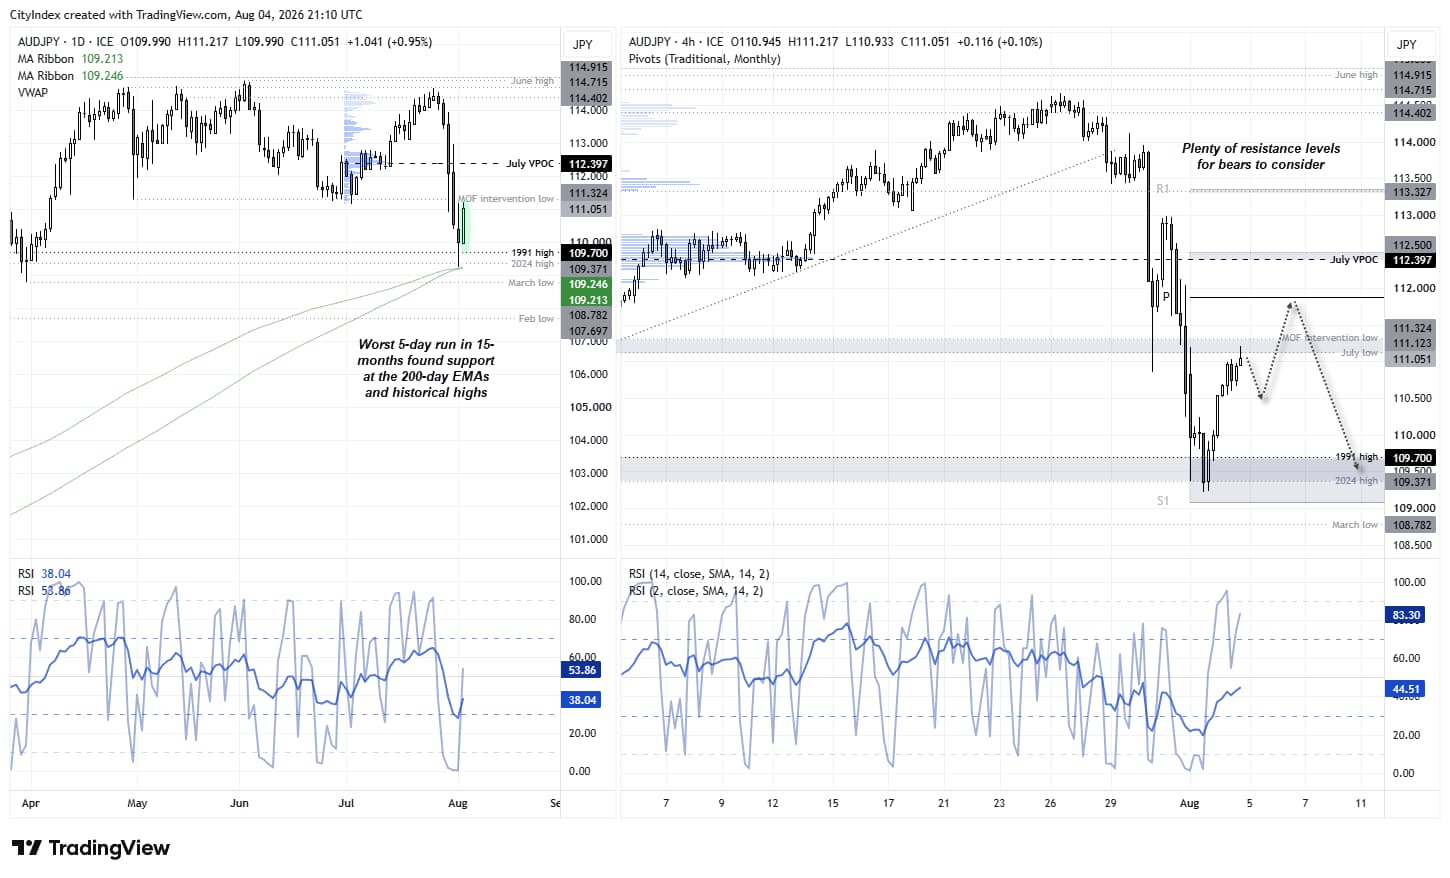
After its worst five-day run in 15 months, AUD/JPY found support at its 200-day moving averages and formed a bullish engulfing day. Under normal circumstances, this could provide the foundation for a decent rebound, but traders are right to remain wary of betting against the Japanese yen too aggressively given the scale of currency intervention over the past week. I therefore suspect that, as with USD/JPY, bears may be looking to fade rallies around resistance levels.
Tuesday's high stalled around the July low, the 111.00 handle and the prior intervention level. The monthly pivot point also sits just beneath the 112.00 handle, while the July VPOC is near 112.50. Ultimately, bears have several notable resistance levels to monitor for evidence of a potential swing high.
Source: ICE, TradingView


AUD/NZD Bears Defend the 1.20 Handle
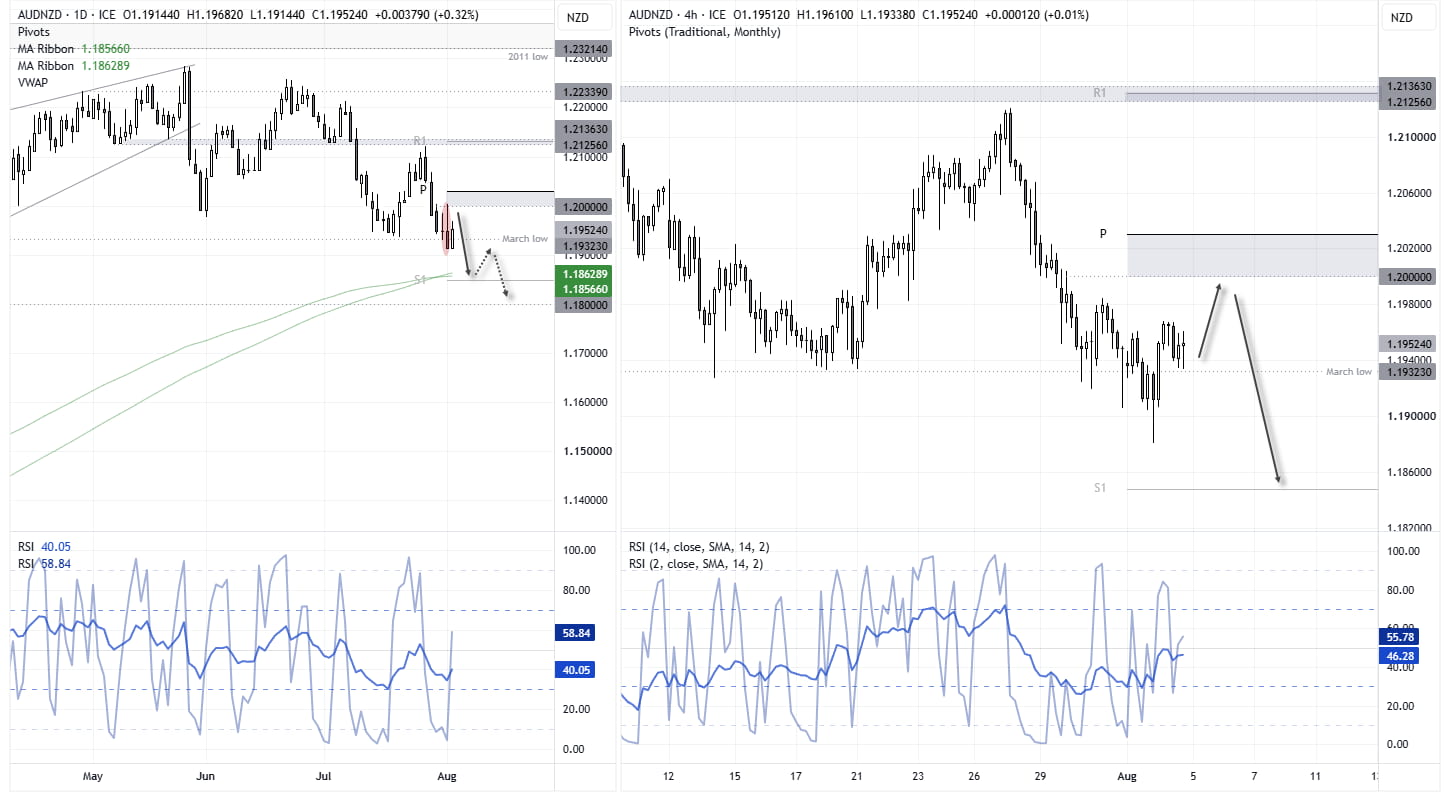
The Aussie is in a clear downtrend against the Kiwi dollar on the daily chart, although it is trying to form a swing low. Monday's bearish outside candle met resistance at the 1.20 handle before closing beneath the March low, although Tuesday's bullish inside day suggests a tentative attempt to form a trough.
Today's New Zealand employment figures could determine whether hawkish RBNZ bets help push AUD/NZD towards the 200-day moving averages at 1.1556, or whether bulls have another crack at 1.20. But until we see a break or daily close above 1.20, risks remain skewed to the downside, with a break beneath the 200-day moving averages bringing 1.18 into focus.
Source: ICE, TradingView
View the full economic calendar
View the full economic calendar
-- Written by Matt Simpson
Follow Matt on Twitter @cLeverEdge
How to trade with City Index
You can trade with City Index by following these four easy steps:
- Open an account, or log in if you’re already a customer
• Open an account in the UK
• Open an account in Australia
• Open an account in Singapore
- Search for the market you want to trade in our award-winning platform
- Choose your position and size, and your stop and limit levels
- Place the trade
Related tags:
Latest market news




The complete CFD trading experience
Award-winning platforms, competitive spreads, low commissions and dedicated support.
We live and breathe the markets and are dedicated to helping traders realise their ambitions as we continue to set the industry bar.
Economic calendar
Web Trader platform
Our sophisticated web-based platform is packed with features.
Related articles
USD/JPY Forecast: Is Rising Japanese Inflation Supporting the Yen?
As the trading week comes to an end, one of the most relevant developments in the FX market has been the renewed strength of the Japanese yen. This can be seen in the recent performance of USD/JPY, which has fallen nearly 1.0% over the last two trading sessions, highlighting a meaningful recovery in the Japanese currency against the U.S. dollar.
Silver forecast: metals liquidation drags XAG/USD into $50-55 support
Silver has broken its July low and slipped into a long-term support zone as the selling in precious metals deepens. The chart shows where the metal could bottom, and next week's Fed decision may decide whether it does.


Australian Dollar Forecast: AUD/USD Support Reversal Sparks Monthly Range Breakout 10 23 2026
A sharp reversal off key support has fueled the AUD/USD recovery, with resistance now in focus ahead of next week’s Fed decision and Australian CPI.

StoneX Europe Ltd may make third party material available on this website which may contain information included but not limited to the conditions of financial markets. The material is for information purposes only and does not contain, and should not be construed as containing, investment advice and/or investment recommendation and/or an investment research and/or an offer of or solicitation for any transactions in financial instruments; any decision to enter into a specific transaction shall be made by the client following an assessment by him/her of their situation.
StoneX Europe Ltd makes no representation or warranty and assumes no liability as to the accuracy or completeness of the information provided, nor any loss arising from any investment based on a recommendation, forecast or other information supplied. You should always seek independent advice as to your suitability to speculate in any related markets and your ability to assume the associated risks, if you are at all unsure. We are not under any obligation to update any such material. Any opinion made may be personal to the author and may not reflect the opinion of StoneX Europe Ltd.