


Gold Price Outlook: Can Quiet Accumulation Trigger a Breakout?
Gold prices are holding above 4,000 as futures positioning, options markets and price action hint that bulls may be quietly accumulating.
Share this:

Gold has lost nearly 30% from its January record high, yet bulls continue to defend support around the 4,000 area. While the broader trend remains bearish, improving futures positioning, firmer options sentiment and constructive price action suggest quiet accumulation may be underway, raising the prospect of a bullish breakout.
View related analysis:
Quiet Accumulation Could Be Setting Gold Up for a Breakout
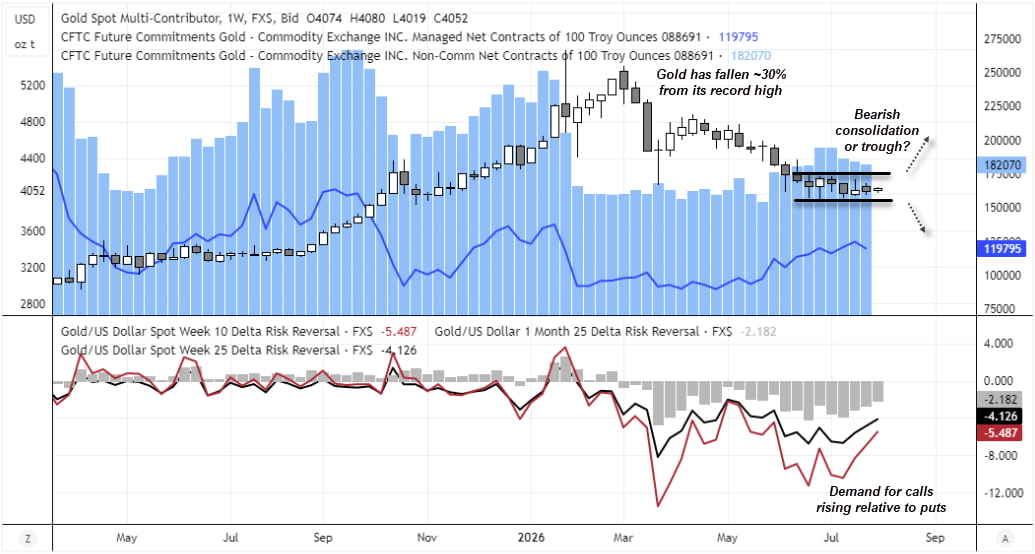
Gold prices have lost just under a third of their value against the US dollar since reaching their last record high in January. The bearish trend remains well established, although bulls have done a great job of defending the 4,000 area since late June. This begs the question of whether bears are merely pausing for breath as they await a bearish breakout from a classic trend consolidation pattern, or whether we are instead heading towards a bullish breakout. I am leaning towards the latter.
This content was created by an affiliate of FOREX.com and represents the views and opinions of the author/speakers, not the views and opinions of FOREX.com, StoneX Group Inc., or its subsidiaries. The content has not been independently reviewed by FOREX.com.
Gold Futures and Options Point to Mild Accumulation
The weekly gold futures chart shows the sideways range it has traded within over the past few weeks. Yet subtle clues of bullish accumulation appear to be forming. Risk reversals are moving higher, suggesting demand for calls is outpacing demand for puts. Put differently, demand for downside protection is now lagging despite prices failing to move lower. Furthermore, net-long exposure among asset managers has been trending higher overall since late April. Granted, it was a touch lower last week, and bullish bets among large speculators have declined over the past three weeks. Still, overall, gold futures traders are more bullish than they were a couple of months ago.
Source: COMEX, CFTC (COT), LSEG

Gold Bulls Defend 4,000 as Momentum Improves
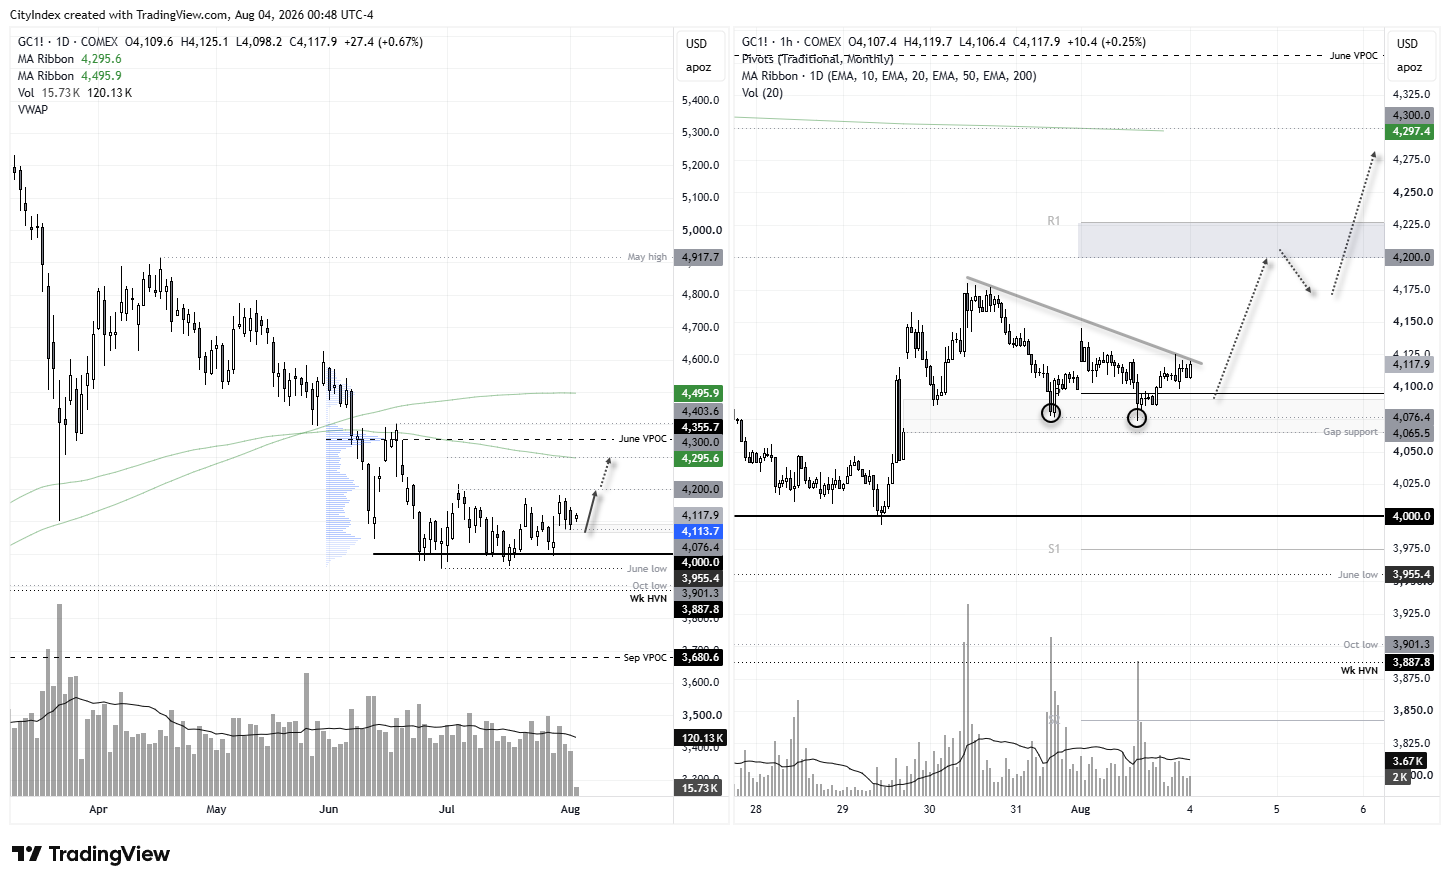
The daily chart shows a strong gap higher from Wednesday's close around the 4,000 area. The fact that there were so many failed attempts to break decisively beneath 4,000 before this gap higher suggests to me that gold bulls have been quietly accumulating around these cycle lows.
The 1-hour chart shows price action drifting lower in what appears to be a corrective move, while a double bottom has formed above the gap support. With prices now attempting to extend gains from the monthly pivot point, bulls may be targeting a move towards 4,200. If the US dollar is forced lower alongside the Japanese yen in the coming weeks, it could also allow gold to break above the monthly R1 pivot and head towards the 200-day EMA around 4,300.
Source: COMEX, CFTC (COT), LSEG
View the full economic calendar
-- Written by Matt Simpson
Follow Matt on Twitter @cLeverEdge
Related tags:


The complete CFD trading experience
Award-winning platforms, competitive spreads, low commissions and dedicated support.
We live and breathe the markets and are dedicated to helping traders realise their ambitions as we continue to set the industry bar.
Economic calendar
Web Trader platform
Our sophisticated web-based platform is packed with features.
Related articles
Forex & Gold Outlook: Dollar Dominates, Crosses Diverge
The US dollar rally gathers momentum as forex crosses develop contrasting technical setups. Matt Simpson examines eight FX markets and gold for potential trading opportunities.

Gold Outlook: Asia Buys the Dip, US Hammers the Rip
Asia buys the dip, the US sells the rip. Hourly gold, dollar and Treasury yield data reveal a regional divide that has become especially pronounced since September.


US dollar forecast: USD/JPY and USD/CHF in focus | Forex Friday
Sticky US inflation and a hawkish Fed have kept the dollar firm across the majors, with USD/JPY pressing on the 160 handle. Here are the levels that matter on USD/JPY and USD/CHF as next week's retail sales, Nvidia results and FOMC minutes approach.

StoneX Europe Ltd may make third party material available on this website which may contain information included but not limited to the conditions of financial markets. The material is for information purposes only and does not contain, and should not be construed as containing, investment advice and/or investment recommendation and/or an investment research and/or an offer of or solicitation for any transactions in financial instruments; any decision to enter into a specific transaction shall be made by the client following an assessment by him/her of their situation.
StoneX Europe Ltd makes no representation or warranty and assumes no liability as to the accuracy or completeness of the information provided, nor any loss arising from any investment based on a recommendation, forecast or other information supplied. You should always seek independent advice as to your suitability to speculate in any related markets and your ability to assume the associated risks, if you are at all unsure. We are not under any obligation to update any such material. Any opinion made may be personal to the author and may not reflect the opinion of StoneX Europe Ltd.