



Australian Dollar Outlook: AUD/USD, AUD/JPY, AUD/CAD Momentum Slows
Australian dollar momentum shows signs of fatigue as AUD/USD tests 70c, AUD/JPY stalls near 2024 highs and AUD/CAD flashes a reversal signal.
Share this:

Volatility surged across markets this week as the US dollar slid to a seven-month low and risk appetite drove outsized intraday ranges across FX, commodities and equities. Base metals once again led the action, with sharp swings in gold, silver and copper spilling over into Australian dollar pairs. While AUD strength remains intact at a broader level, price action across key crosses is beginning to show signs of fatigue, raising the risk of consolidation or shallow pullbacks into next week.
View related analysis:
View related analysis:
Australian Dollar Momentum Slows Across AUD/USD, AUD/JPY and AUD/CAD
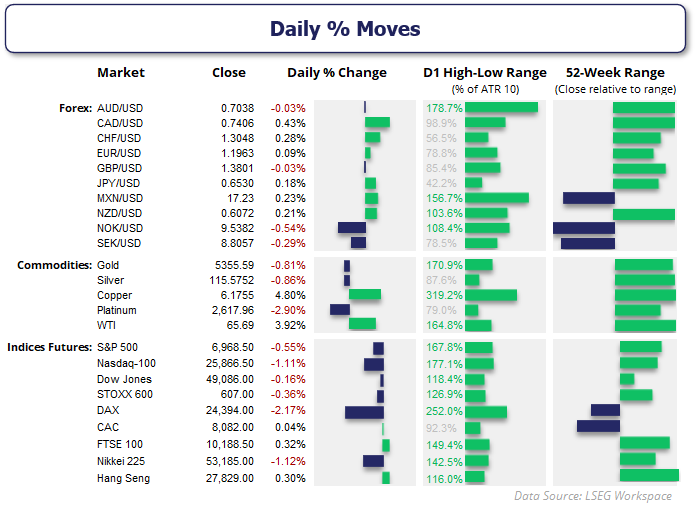
It’s been a volatile week for traders, to say the least. The US dollar plunged to a seven-month low and, at the time of writing, is on track for its worst two-week run since April. Thursday saw volatility elevated across markets, with most major indices, commodities and currencies we track posting ranges well above their average daily moves. In particular, base metals raised a few eyebrows.
Source: LSEG
Gold surged to 5600 on Thursday before plunging back to just shy of 5100, ultimately closing flat on the day. That kind of high-range, indecisive session usually means both bulls and bears were punished. With no obvious catalyst, it suggests plenty of burned fingers — and that may keep traders sidelined in the near term, dampening follow-through volatility.
Silver also finished flat, despite posting a 12.3% intraday range that briefly pushed beyond 120 and below 110 before reverting back to the open. Copper bulls fared better, with futures closing up 6.3% after trading as high as 10% earlier in the session.
Given the strong rally in base metals has been a key driver of the Australian dollar — alongside a weaker US dollar and rising expectations of an RBA hike — volatility in the metals space has spilled over into the Aussie as well.


AUD/USD Technical Analysis: Australian Dollar vs US Dollar
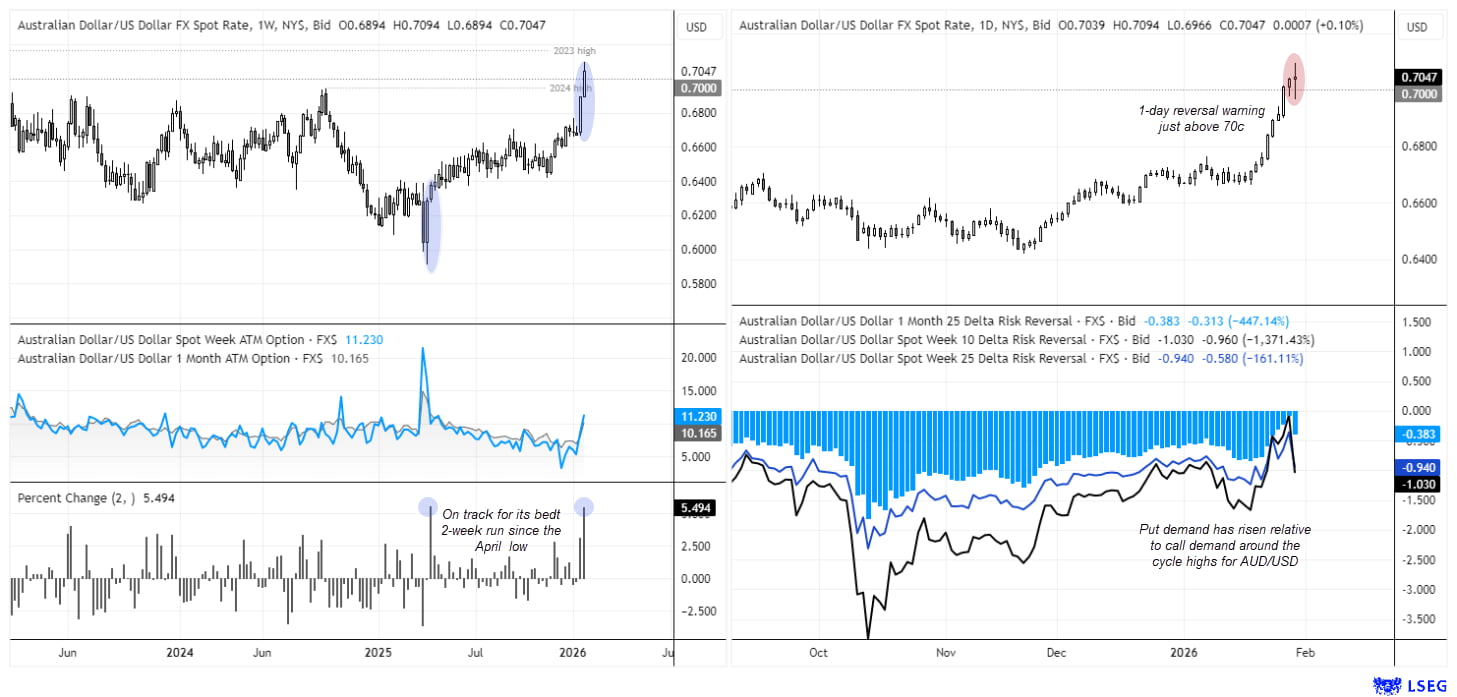
The Australian dollar is on track for its best two-week run since the April low, which marked the broader risk-on rally amid the scaling back of Trump’s tariffs. Implied volatility has risen to a 41-week high, though one could argue the move may be running out of steam in the near term.
AUD/USD bulls have also tagged the 70c level for the first time in 11 months this week, a big round number that could prompt the strong rally to at least pause for breath.
It is therefore interesting to note that a doji formed on Thursday, signalling hesitation from the bull camp to extend the rally. Of particular interest, risk reversals have dipped lower, pointing to rising demand for puts relative to calls. Given the strong rally into 70c, the one-day reversal and increasing downside protection among options traders, bulls may want to tread with caution around current levels.
Source: TradingView
AUD/JPY Technical Analysis: Australian Dollar vs Japanese Yen
The Australian dollar has taken full advantage of the weaker yen over the past nine months, with AUD/JPY rising just under 27%. But key resistance levels loom, which brings the potential for a pause in trend of at least a minor retracement.
Of course, risks of a larger pullback AUD/JPY are apparent if Japan’s Ministry of Finance (MOF) actually do intervene in the currency to cushion the yen’s decline. But until then, the trend is assumed to remains intact, and bulls may be on the sidelines seeking dips in anticipation of an eventual breakout above the 2024 high (109.37).
Note that Thursday’s low respected the 20-day EMA (106.49) and January VPOC (106.50), making it a pivotal level for traders. A break beneath which hints at a deeper pullback and bring the 105 handle into view, near the 50-day EMA.

Source: ICE, TradingView


AUD/CAD Technical Analysis: Australian Dollar vs Canadian Dollar
Another clue for Australian dollar traders sits with AUD/CAD, as the pair has formed a bearish outside day at the 2023 high. Reversals in currencies can take time, and sometimes weakness appears on some crosses ahead of others — meaning reversals can be staggered across multiple pairs before the tide truly turns.
As such, the fact that AUD/CAD has delivered a more definitive near-term reversal signal ahead of AUD/JPY and AUD/USD should at least be noted by AUD/USD bulls heading into next week.

Source: ICE, TradingView
View the full economic calendar
View the full economic calendar
-- Written by Matt Simpson
Follow Matt on Twitter @cLeverEdge
How to trade with City Index
You can trade with City Index by following these four easy steps:
- Open an account, or log in if you’re already a customer
• Open an account in the UK
• Open an account in Australia
• Open an account in Singapore
- Search for the market you want to trade in our award-winning platform
- Choose your position and size, and your stop and limit levels
- Place the trade
Related tags:
Latest market news




The complete CFD trading experience
Award-winning platforms, competitive spreads, low commissions and dedicated support.
We live and breathe the markets and are dedicated to helping traders realise their ambitions as we continue to set the industry bar.
Economic calendar
Web Trader platform
Our sophisticated web-based platform is packed with features.
Related articles
USD/JPY Weekly Outlook: Volatility Has Left the Building
The yen has ignored broad dollar weakness, falling Treasury yields and renewed market turbulence. Yet its relationship with US interest rates remains intact. So why is USD/JPY going absolutely nowhere fast?

Swiss Franc Forecast: USD/CHF Seven-Week Rally Reverses From Yearly Highs 10 16 2026
A sharp rejection from fresh highs has shifted momentum in favor of USD/CHF bears, raising the stakes for a critical support test.


AUD/USD Bulls Fight Back After Australian Jobs Shock
AUD/USD has been hit by another ugly Australian employment report, sending RBA rate hike expectations sharply lower. Yet the relationships driving the currency have shifted since quarter-end, and improving risk appetite could provide the fuel for a recovery.
StoneX Europe Ltd may make third party material available on this website which may contain information included but not limited to the conditions of financial markets. The material is for information purposes only and does not contain, and should not be construed as containing, investment advice and/or investment recommendation and/or an investment research and/or an offer of or solicitation for any transactions in financial instruments; any decision to enter into a specific transaction shall be made by the client following an assessment by him/her of their situation.
StoneX Europe Ltd makes no representation or warranty and assumes no liability as to the accuracy or completeness of the information provided, nor any loss arising from any investment based on a recommendation, forecast or other information supplied. You should always seek independent advice as to your suitability to speculate in any related markets and your ability to assume the associated risks, if you are at all unsure. We are not under any obligation to update any such material. Any opinion made may be personal to the author and may not reflect the opinion of StoneX Europe Ltd.