







Australian Dollar Price Action Setups: AUD/USD, AUD/NZD, AUD/JPY
Key levels and patterns emerge for the Australian dollar across USD, NZD, and JPY pairs ahead of CPI data and shifting central bank expectations.
Share this:

The Australian dollar is showing distinct price action setups across its major crosses, with AUD/USD reacting to Fed turmoil, AUD/NZD pressured by RBA cut bets, and AUD/JPY pivoting near key support. With Australia’s quarterly CPI due next week and global central bank narratives shifting, traders should be on alert for breakout or reversal opportunities across AUD pairs.
View related analysis:
View related analysis:
AUD/USD Climbs as RBA Holds for CPI and Powell Faces Resignation Pressure
The RBA minutes effectively confirmed what I have been saying since they opted to hold rates at their last meeting: the RBA want to see the quarterly CPI figures before deciding. Inflation excluding volatile items and travel has shown itself to be a better predictor of the quarterly inflation figures, according to the RBA. And given it has now slowed as fast as anticipated, they decided to hold rates. Quarterly inflation figures drop next Wednesday, marking it the big event for the week for Australian dollar traders
Powell Under Fire: Fed Chair Faces Growing Pressure as USD Falls
The US dollar continued lower on Tuesday, sending the USD index down to an 8-day low. The pressure for Powell to resign intensified following comments for him to do so by Mohamed El-Erian. The pressure has been building for months, from Trump’s direct insults to scrutiny of the Fed office refit, to calls from Treasury Secretary Scott Bessent for the Fed chair to resign. My guess is that if this was going to blow over, it would have by now anyway. And as an ousted Powell will likely pave the way for a dovish minion to be installed by Trump, the US dollar could face further selling pressure on bets of lower rates and major concerns over Fed independence.
AUD/USD Technical Analysis: Australian Dollar vs US Dollar
The Australian dollar rose for a third straight day on Wednesday, with AUD/USD closing above Thursday’s open—the session when weak employment data revived RBA rate cut bets. However, as yesterday’s move was largely driven by a weaker US dollar during thin liquidity conditions, I suspect the upside for AUD/USD could be limited.
AUD/USD also struggled to retest 66c before momentum turned. And if the US dollar avoids breaking to new cycle lows in the near term, bears may look to fade into the current rally—at least over the short run.

Chart analysis by Matt Simpson - data source: TradingView AUD/USD
AUD/JPY Technical Analysis: Australian Dollar vs Japanese Yen
The Australian dollar has maintained a bullish trend against the Japanese yen on the daily chart, supported by ongoing yen weakness. However, momentum stalled near the February high, prompting a controlled pullback.
Key support has emerged around 95.75—the March high—with Tuesday’s low respecting the 200-day simple moving average (SMA). The 20-day SMA also aligns with this zone, reinforcing it as a pivotal support cluster. Notably, a doji candlestick formed at this level, indicating indecision and hinting at a potential swing low.
If AUD/JPY holds above Tuesday’s low (95.63), bulls may target a rebound towards 97.00, just beneath the recent swing high. A confirmed break above that level would suggest bullish continuation and open the path to further upside.
Conversely, a break beneath 95.60 signals a deeper retracement, with the next support zone between 94.00 and 94.50—home to the 50-day SMA (94.32) and a high-volume node (HVN).
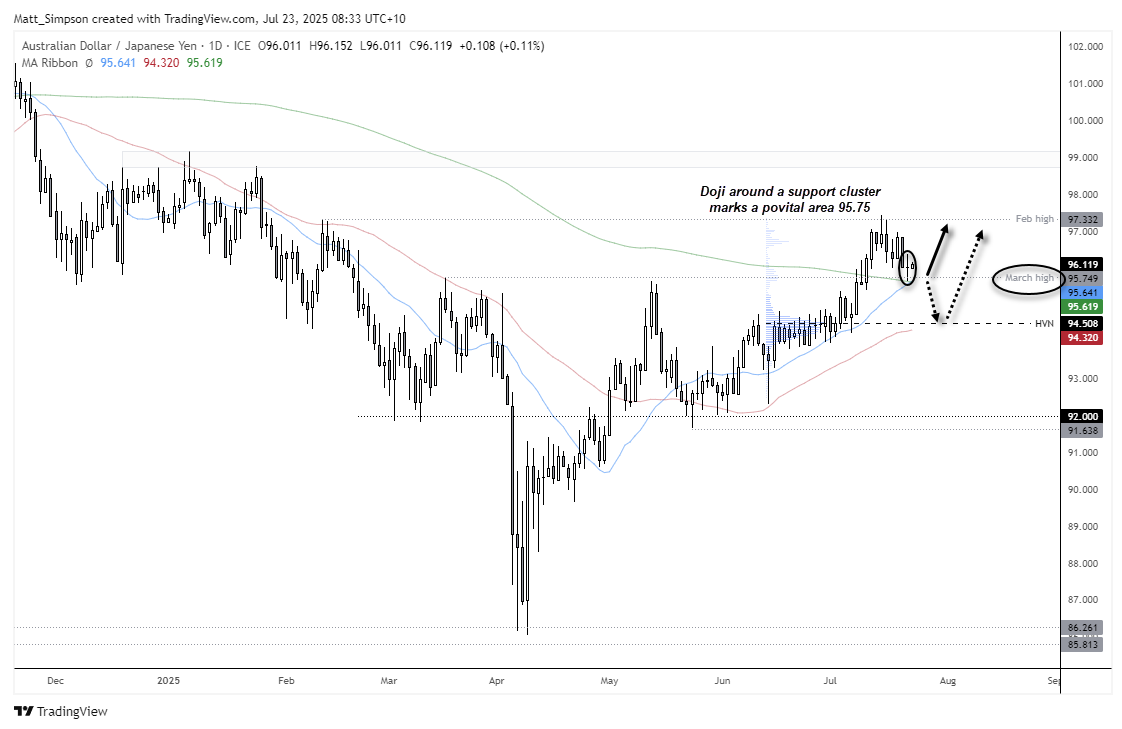
Chart analysis by Matt Simpson - data source: TradingView AUD/JPY
AUD/NZD Technical Analysis: Bearish Reversal Risks for Australian Dollar
The weekly chart for AUD/NZD suggests a 5-wave Elliott pattern is unfolding from the November high. A completed ABC correction implies wave 4 may have already peaked, especially as the weekly RSI (2) recently hit its most overbought reading since July—before faltering below the 1.10 handle and forming a bearish candle last week.
A measured projection of waves 1 through 3 from the wave 4 high points to potential support near the April low at 1.0652, aligning closely with the 61.8% Fibonacci retracement. This also places the possible wave 5 termination near the same level.
Near term, bears could look to fade rallies towards last week’s high, targeting a move towards 1.08. A deeper decline could develop if the Reserve Bank of Australia (RBA) signals a dovish shift—especially with the Australian dollar facing renewed macro pressure against the New Zealand dollar.

Chart analysis by Matt Simpson - data source: TradingView AUD/NZD
AUD/NZD Faces Resistance at 200-Day SMA Amid RBA Rate Cut Bets
A bearish engulfing candle formed on Thursday following Australia’s softer-than-expected employment report, which reignited speculation of an RBA rate cut. The pair closed firmly below the 200-day simple moving average (SMA) and logged its second consecutive daily loss—suggesting mean reversion may be underway within the bullish channel on the AUD/NZD daily chart.
Importantly, AUD/NZD has now failed twice to close above the 200-day SMA, reinforcing that level as key resistance for bears to defend. A bearish pinbar formed on Tuesday adds to the short-term bearish case, potentially marking the end of a minor bounce and paving the way for further downside in the Australian dollar versus the New Zealand dollar.
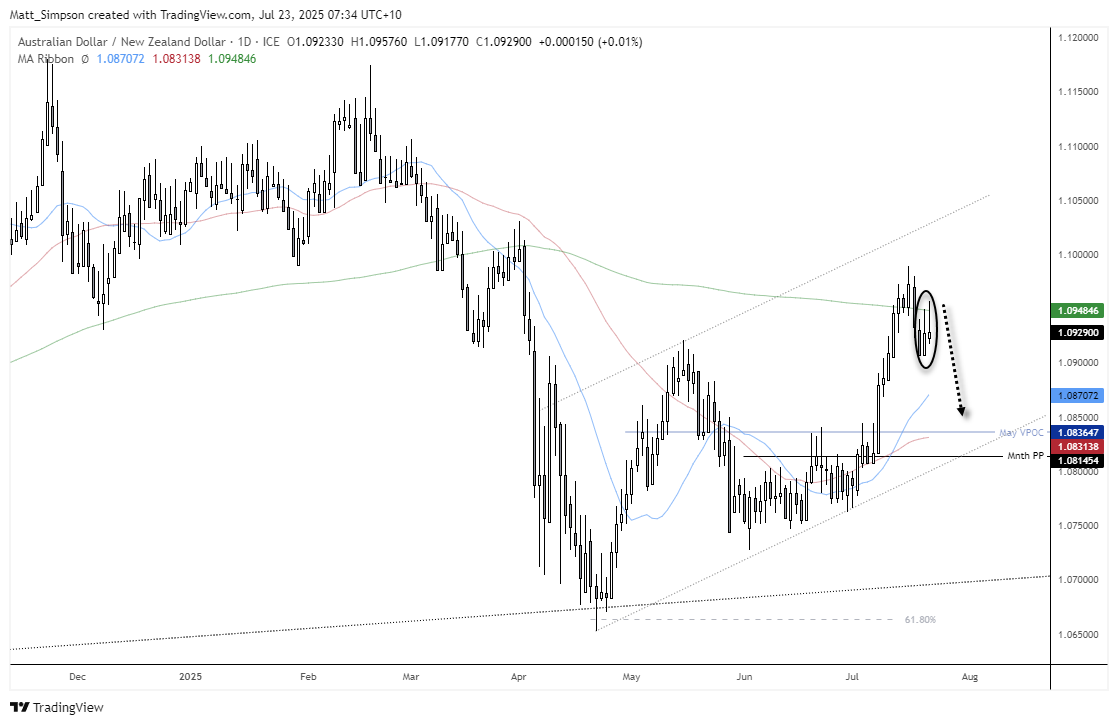
Chart analysis by Matt Simpson - data source: TradingView AUD/NZD
View the full economic calendar
View the full economic calendar
-- Written by Matt Simpson
Follow Matt on Twitter @cLeverEdge
How to trade with City Index
You can trade with City Index by following these four easy steps:
- Open an account, or log in if you’re already a customer
• Open an account in the UK
• Open an account in Australia
• Open an account in Singapore
- Search for the market you want to trade in our award-winning platform
- Choose your position and size, and your stop and limit levels
- Place the trade


The complete CFD trading experience
Award-winning platforms, competitive spreads, low commissions and dedicated support.
We live and breathe the markets and are dedicated to helping traders realise their ambitions as we continue to set the industry bar.
Economic calendar
Web Trader platform
Our sophisticated web-based platform is packed with features.
Related articles
Euro Technical Forecast: EUR/USD Snaps Five-Week Slide at Critical Support 10 17 2026
Euro is attempting to regain its footing as stretched momentum raises the stakes for the next move ahead of key PMI data and central bank decisions.

USD/JPY Weekly Outlook: Volatility Has Left the Building
The yen has ignored broad dollar weakness, falling Treasury yields and renewed market turbulence. Yet its relationship with US interest rates remains intact. So why is USD/JPY going absolutely nowhere fast?


Swiss Franc Forecast: USD/CHF Seven-Week Rally Reverses From Yearly Highs 10 16 2026
A sharp rejection from fresh highs has shifted momentum in favor of USD/CHF bears, raising the stakes for a critical support test.
StoneX Europe Ltd may make third party material available on this website which may contain information included but not limited to the conditions of financial markets. The material is for information purposes only and does not contain, and should not be construed as containing, investment advice and/or investment recommendation and/or an investment research and/or an offer of or solicitation for any transactions in financial instruments; any decision to enter into a specific transaction shall be made by the client following an assessment by him/her of their situation.
StoneX Europe Ltd makes no representation or warranty and assumes no liability as to the accuracy or completeness of the information provided, nor any loss arising from any investment based on a recommendation, forecast or other information supplied. You should always seek independent advice as to your suitability to speculate in any related markets and your ability to assume the associated risks, if you are at all unsure. We are not under any obligation to update any such material. Any opinion made may be personal to the author and may not reflect the opinion of StoneX Europe Ltd.