



Bitcoin Slides to 70,000: Risk Reset or Deeper Drawdown?
Bitcoin Outlook: the sharp risk-off move across AI-exposed tech and software stocks has accelerated Bitcoin’s drawdown toward the 70,000 mark, following the extended consolidation seen between November 2025 and January 2026. The key question now is whether this move represents a healthy risk reset or an early warning of deeper downside.
Share this:

Key Events
• AI-exposed sectors faced steep drawdowns amid rising concerns around stretched valuations, software disruption risks, and margin compression
• Bitcoin was swept into the selloff due to its elevated correlation with software stocks, and shared institutional investor base.
The latest drawdown across Bitcoin, AI, and technology assets was driven by a sharp reassessment of the AI trade. Investors have shifted from viewing artificial intelligence as a guaranteed growth engine to recognizing it as a potentially disruptive force that could undermine legacy software business models, compress margins, and weaken pricing power. This narrative shift collided with growing anxiety over elevated AI and software valuations, rising capital expenditure requirements for data centers, and uncertainty around when, or if, these investments will translate into sustainable earnings growth.
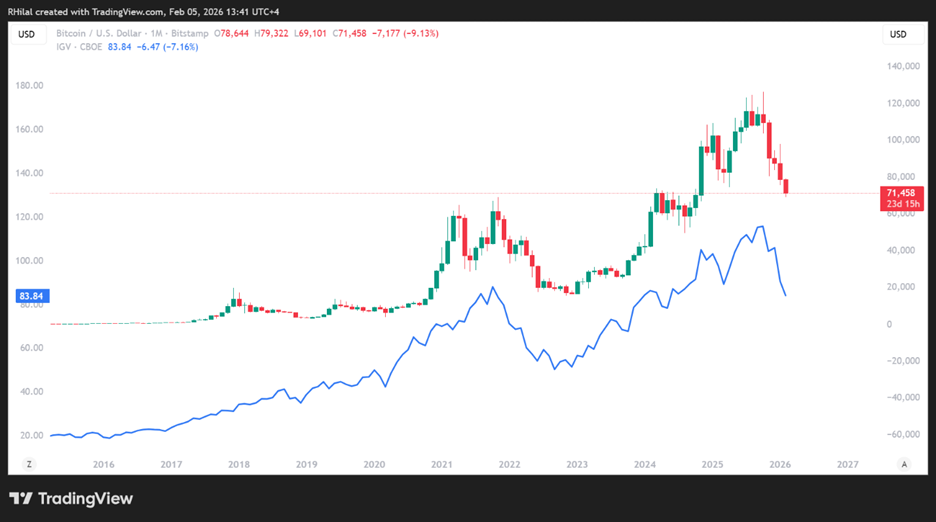
Bitcoin vs iShares Expanded Tech Software ETF
Source: Trading view
Bitcoin was pulled into the selloff in line with its correlation with software stocks, as illustrated by the comparison with the iShares Expanded Tech Software ETF. This relationship reflects not only price correlation, but also a shared institutional investor base and Bitcoin’s inability to attract defensive flows during periods of equity stress. As risk rotated out of AI-exposed sectors, capital shifted away from software rather than from equities broadly, with the Nasdaq maintaining consolidation above the 24,600 mark while the Dow continued to hover near record highs around 49,400.
One chart that stood out during this rotation was Nvidia’s developing head-and-shoulders risk structure, contrasted with the Dow’s hold near record highs and Nasdaq’s fragile consolidation, as shown in the charts below.
Weekly Chart: NVDA, Dow, Nasdaq – Log Scale

Source: Tradingview
As for the impact on bitcoin
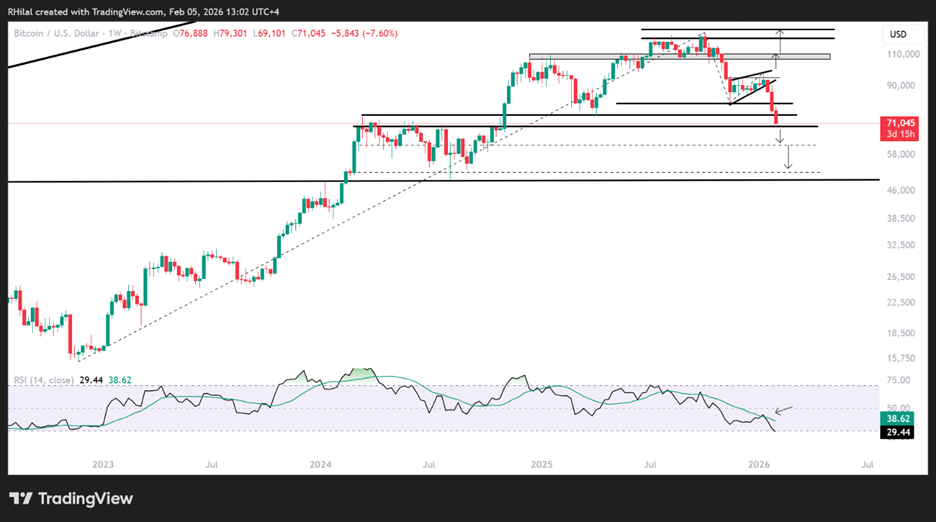
Bitcoin Outlook: Weekly Time Frame – Log Scale
Source: Trading view
From a weekly perspective, Bitcoin has extended its drawdown to more than 45% from the 126,000 record high. This move follows the bearish wedge structure previously discussed in “Bitcoin Under Pressure as Macro Defensiveness Persists,” which developed between November 2025 and January 2026 and has now resolved lower toward the 70,000 psychological threshold.
If the drawdown continues to extend, the next key levels to monitor lie below 68,000, followed by 60,000 and 50,000, which may emerge as potential dip-buying zones rather than immediate breakdown levels. Notably, the weekly RSI has fallen to levels last seen in 2022, when Bitcoin traded near 15,000, shifting the risk-reward balance toward accumulation rather than aggressive selling from these zones.
On the upside, Bitcoin would need to reclaim the 80,000, 95,000 and 110,000 levels to reassert a bullish outlook and reopen the path toward prior highs and potential extensions toward the 130,000 and 150,000 areas.
The current AI-led drawdown increasingly resembles a broader risk reset rather than a structural trend break, in line with previous thoughts in Gold Reclaims 5000, Nasdaq Reclaims Bearish Bias From both a practical and financial perspective, artificial intelligence remains deeply embedded across global economies, institutional agendas, and corporate strategies. While the recent selloff reflects a reset in risk appetite, momentum, and valuation expectations, the longer-term AI trend itself appears intact following what increasingly looks like a necessary recalibration.
Written by Razan Hilal, CMT
Follow on X: @Rh_waves
Latest market news




The complete CFD trading experience
Award-winning platforms, competitive spreads, low commissions and dedicated support.
We live and breathe the markets and are dedicated to helping traders realise their ambitions as we continue to set the industry bar.
Economic calendar
Web Trader platform
Our sophisticated web-based platform is packed with features.
Related articles
USD/JPY Weekly Outlook: AI earnings could overshadow the Fed and BoJ
AI sentiment has become a major driver of US Treasury yields and USD/JPY. With Microsoft, Alphabet and Amazon reporting this week, central bank decisions may have competition for traders' attention.
Australian Dollar Forecast: AUD/USD Support Reversal Sparks Monthly Range Breakout 10 23 2026
A sharp reversal off key support has fueled the AUD/USD recovery, with resistance now in focus ahead of next week’s Fed decision and Australian CPI.


Crude Oil Forecast: Weekend Iran Strike Fears Lift Oil Toward War Highs
Brent crude oil is accelerating above $110 as traders price in the risk of a US-Israeli strike on Iran over the weekend. How much more of a geopolitical premium can oil build in before the close?

StoneX Europe Ltd may make third party material available on this website which may contain information included but not limited to the conditions of financial markets. The material is for information purposes only and does not contain, and should not be construed as containing, investment advice and/or investment recommendation and/or an investment research and/or an offer of or solicitation for any transactions in financial instruments; any decision to enter into a specific transaction shall be made by the client following an assessment by him/her of their situation.
StoneX Europe Ltd makes no representation or warranty and assumes no liability as to the accuracy or completeness of the information provided, nor any loss arising from any investment based on a recommendation, forecast or other information supplied. You should always seek independent advice as to your suitability to speculate in any related markets and your ability to assume the associated risks, if you are at all unsure. We are not under any obligation to update any such material. Any opinion made may be personal to the author and may not reflect the opinion of StoneX Europe Ltd.