



Bitcoin Tumbles as Strategy Sells Into Weakness
Bitcoin's latest slide comes with an uncomfortable twist: one of its biggest believers is now willing to sell into weakness.
Share this:

- Strategy sells bitcoin for only the second time in its history
- Saylor's "never sell" message faces an awkward reality check
- BTC/USD breaks trend support, 50DMA, 100DMA and 200DMA
- $65,000 eyed as squeeze risk starts to build
The Signal, Not the Sale
Bitcoin is struggling despite buoyant risk appetite elsewhere. Adding to the discomfort, one of its biggest believers is now selling into the weakness.
Michael Saylor's Strategy offloaded 32 bitcoin between May 26 and May 31, raising around $2.5 million. Against holdings of more than 700,000 coins, the sale was immaterial. However, the message wasn't. For years, Saylor has urged investors to buy bitcoin, hold bitcoin and never sell it. Now Strategy says it may offload bitcoin to improve share metrics, support dividend payments or strengthen its financial position.
The shift is notable given Strategy now increasingly relies on preferred securities and yield-paying products backed by its bitcoin holdings. Strategy is effectively raising capital from investors seeking income and using it to accumulate an asset expected to deliver superior returns over time. It's a strategy that may prove highly successful. But it also muddies what was once a simple proposition: buy bitcoin, hodl bitcoin, never sell it.
Waterfall Decline as Squeeze Risk Builds
Source: TradingView
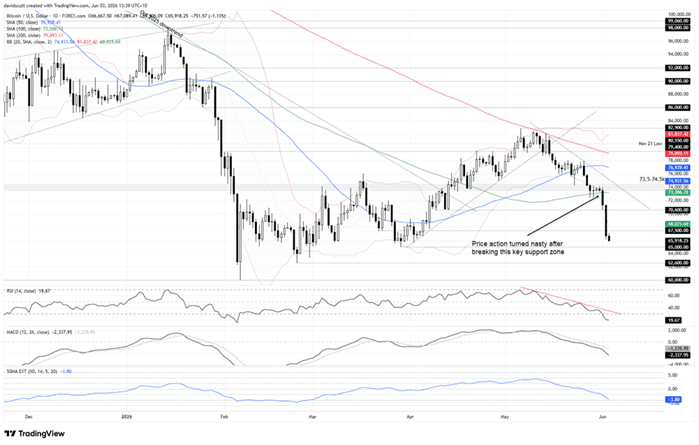
BTC/USD simply looks terrible on the charts, breaking beneath the uptrend it had been trading since late March in May after several failures to clear the 200-day moving average. That eventually saw the price slice through the 50 and 100-day equivalents along with an important support zone between $73,500 and $74,500.
Since the latter gave way, the price has mirrored a waterfall on the daily, with minor supports at $70,600 and $67,500 broken with ease, typical of when you've seen forced liquidations take place. $65,000 is the next downside level of note, coinciding with the swing low set in March. Beyond that, there's little to speak of until the multi-year low near $60,000 set in early February, with $62,600 the only level of note in between.
The message from RSI (14) and MACD shows the bears are in control with downside pressure continuing to strengthen. So fast has the move occurred, both indicators are now encroaching on what are fairly extreme levels even for crypto winters. The stretch indicator shown in the bottom pane is providing a similar message, with the price now trading 3.8 ATR (14) below the 50-day moving average.
While not yet at the levels seen earlier this year, and certainly no guarantee that further weakness won't arrive near-term given the price and oscillator signals, it warns that squeeze risk is building given how stretched the move has become, a point reinforced by the price currently trading beneath the lower Bollinger Band.
If you're getting short around these levels, risk management must rank highly when considering the appropriate reward for doing so. Price action around $65,000 or $67,500, whichever is tested first, may prove instructive on how to proceed, allowing both levels to be incorporated into trade construction.


The complete CFD trading experience
Award-winning platforms, competitive spreads, low commissions and dedicated support.
We live and breathe the markets and are dedicated to helping traders realise their ambitions as we continue to set the industry bar.
Economic calendar
Web Trader platform
Our sophisticated web-based platform is packed with features.
Related articles
EUR/USD, DXY, Silver Price Outlook: Bullish Rebounds on Hold?
EUR/USD, DXY, Silver Price Outlook: Bullish rebounds across currency markets, precious metals, and risk assets are facing renewed pressure as U.S. CPI comes in above expectations and oil-tanker attacks persist in the Strait of Hormuz.

DAX Near Record Levels as Earnings Strength Supports Bulls
The DAX remains firmly positioned near record highs after reclaiming the 26,000 level and extending its recovery toward 26,700. Strong earnings momentum, improving industrial activity and renewed confidence in semiconductor and energy-transition stocks continue to support sentiment. With Siemens Energy and Infineon delivering upbeat signals for 2027, investors are increasingly focused on corporate fundamentals rather than macroeconomic uncertainty.


Nasdaq 100 Outlook: Slingshot rally or false dawn?
Nasdaq 100 futures are threatening to reclaim the 200-day moving average following their largest initial breakdown in more than 26 years. History suggests getting back above it is one thing, staying there another.
StoneX Europe Ltd may make third party material available on this website which may contain information included but not limited to the conditions of financial markets. The material is for information purposes only and does not contain, and should not be construed as containing, investment advice and/or investment recommendation and/or an investment research and/or an offer of or solicitation for any transactions in financial instruments; any decision to enter into a specific transaction shall be made by the client following an assessment by him/her of their situation.
StoneX Europe Ltd makes no representation or warranty and assumes no liability as to the accuracy or completeness of the information provided, nor any loss arising from any investment based on a recommendation, forecast or other information supplied. You should always seek independent advice as to your suitability to speculate in any related markets and your ability to assume the associated risks, if you are at all unsure. We are not under any obligation to update any such material. Any opinion made may be personal to the author and may not reflect the opinion of StoneX Europe Ltd.