





BOOM Canadian Employment Data Much Better than Expected
The Bank of Canada now has their hands full.
Share this:

The headline Employment Change for September was released at 53.7K today vs a market expectation of 10.0K and 81.1K last. The unemployment rate is 5.5% vs 5.7% expected and 5.7% last. Average hourly Wages (YoY) for September also increased 4.3% over August’s number vs 3.8% expected. This is a breath of fresh air for the Canadian economy, which released weaker inflation data and weaker retail sales data late last month.
The Bank of Canada now has their hands full. The BOC will have their next policy meeting on October 30th (which happens to be the same date as the next FOMC policy meeting) where they will release their projections for the economy as well. At the last meeting, BOC President Poloz stated that “the current degree of monetary policy stimulus remains appropriate”. Will this still be true? A rise in employment and earnings, combined with weaker retail sales and lower inflation will make this a tough decision for Poloz and company (note that we will see inflation data one more time before the Oct 30th meeting).
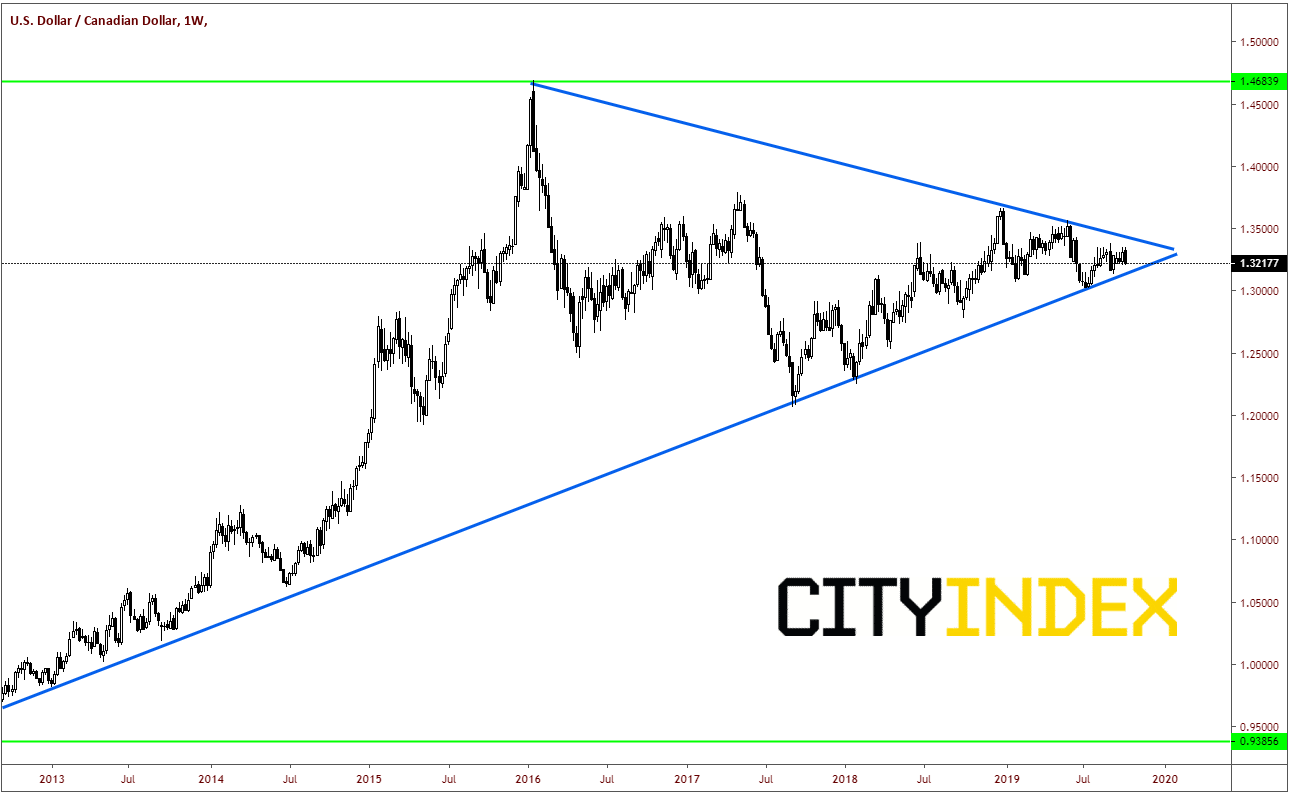
Let’s quickly remind ourselves of where we are on the weekly chart in USD/CAD. We have been in a long-term symmetrical triangle and are currently coiling at the apex. A breakout through either trendline could provide direction over the long term.
Source: Tradingview, City Index
On a 240-minute chart, price failed numerous times to stay above 1.3350, and upon release of today’s employment data, spiked lower through and upward sloping trendline going back to September 10th. For the moment, USD/CAD is holding previous lows near 1.3200. Next support zone is between 1.3150 and 1.3130, prior lows from mid-September.
Source: Tradingview, City Index
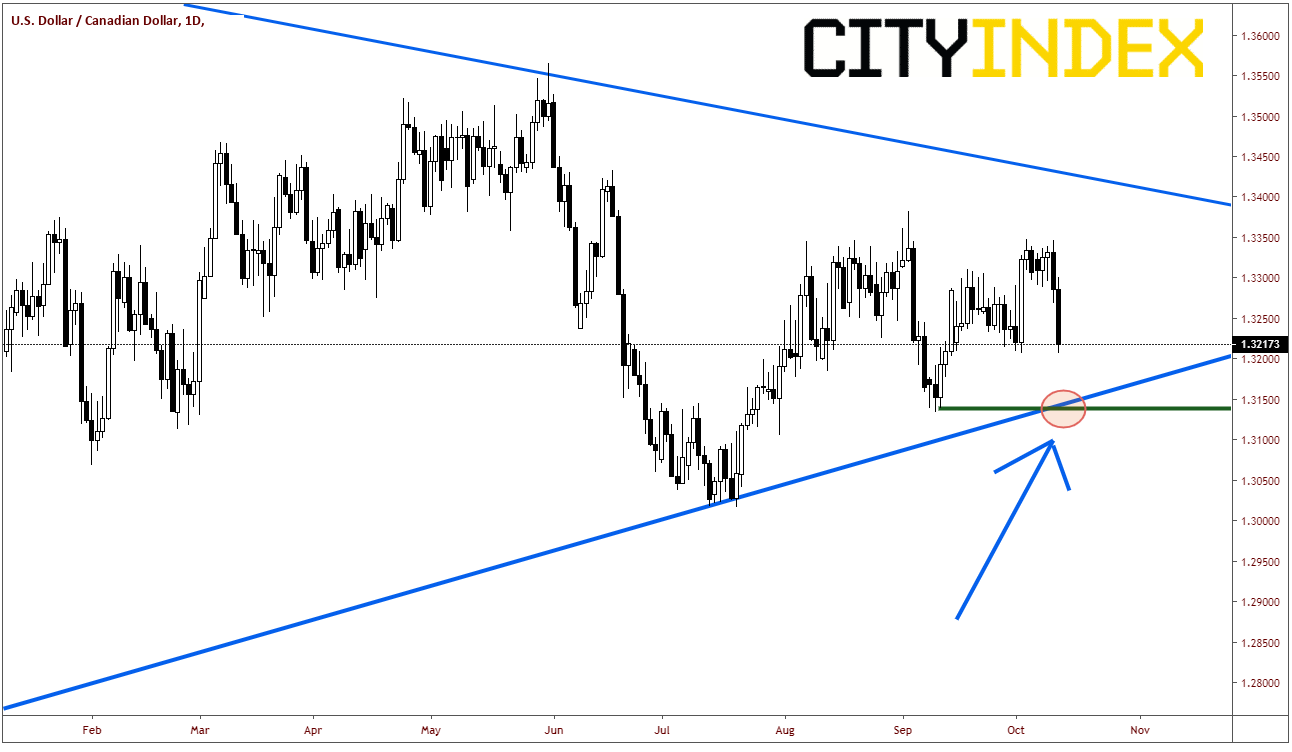
However, on a daily chart, we get a better picture of the horizontal support and the rising weekly trendline near that 1.3130/50 level. If price breaks through these levels, USD/CAD can push much lower towards the 1.2000/1.2300 levels over the lower term.
Source: Tradingview, City Index
Resistance comes in above at the break of the trendline near 1.3240 and above that near prior lows (which now act as resistance) near 1.3270.
The headline Employment Change for September was released at 53.7K today vs a market expectation of 10.0K and 81.1K last. The unemployment rate is 5.5% vs 5.7% expected and 5.7% last. Average hourly Wages (YoY) for September also increased 4.3% over August’s number vs 3.8% expected. This is a breath of fresh air for the Canadian economy, which released weaker inflation data and weaker retail sales data late last month.
The Bank of Canada now has their hands full. The BOC will have their next policy meeting on October 30th (which happens to be the same date as the next FOMC policy meeting) where they will release their projections for the economy as well. At the last meeting, BOC President Poloz stated that “the current degree of monetary policy stimulus remains appropriate”. Will this still be true? A rise in employment and earnings, combined with weaker retail sales and lower inflation will make this a tough decision for Poloz and company (note that we will see inflation data one more time before the Oct 30th meeting).
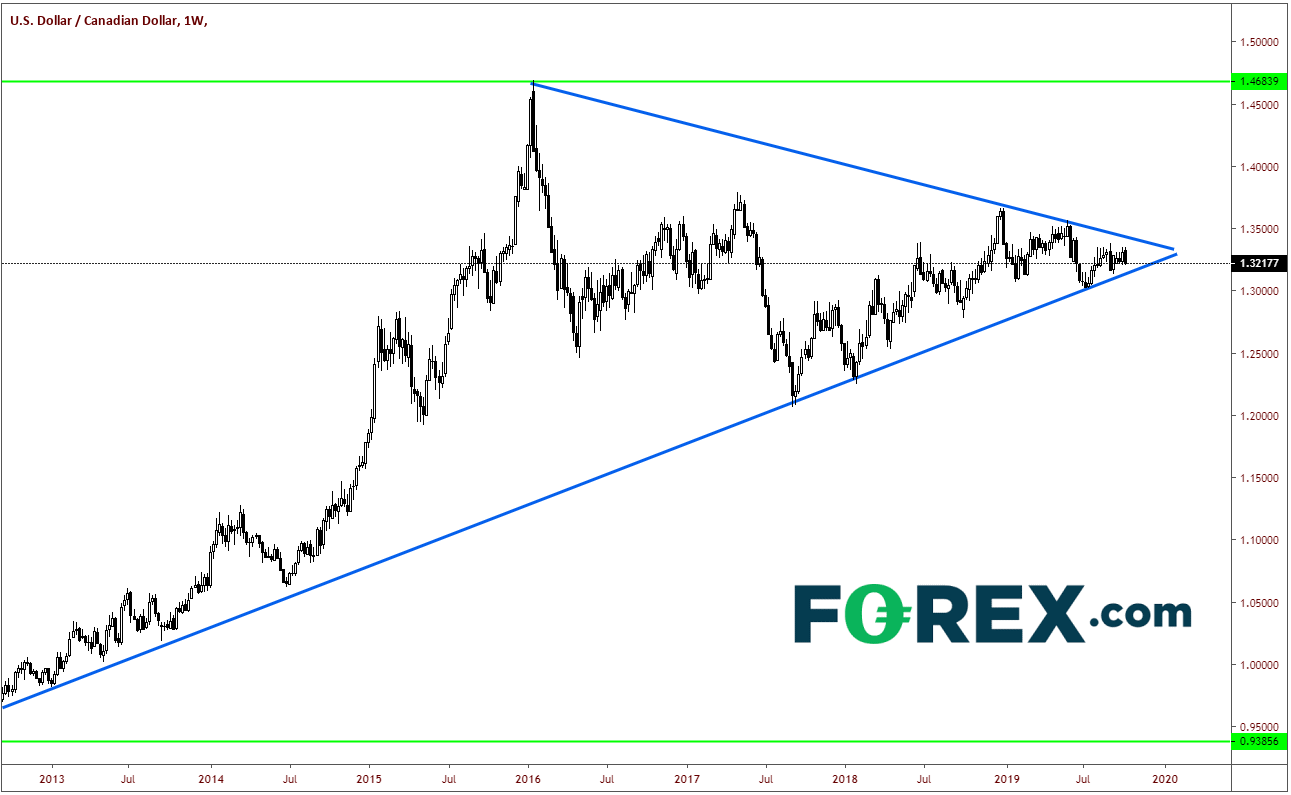
Let’s quickly remind ourselves of where we are on the weekly chart in USD/CAD. We have been in a long-term symmetrical triangle and are currently coiling at the apex. A breakout through either trendline could provide direction over the long term.
Source: Tradingview, FOREX.com
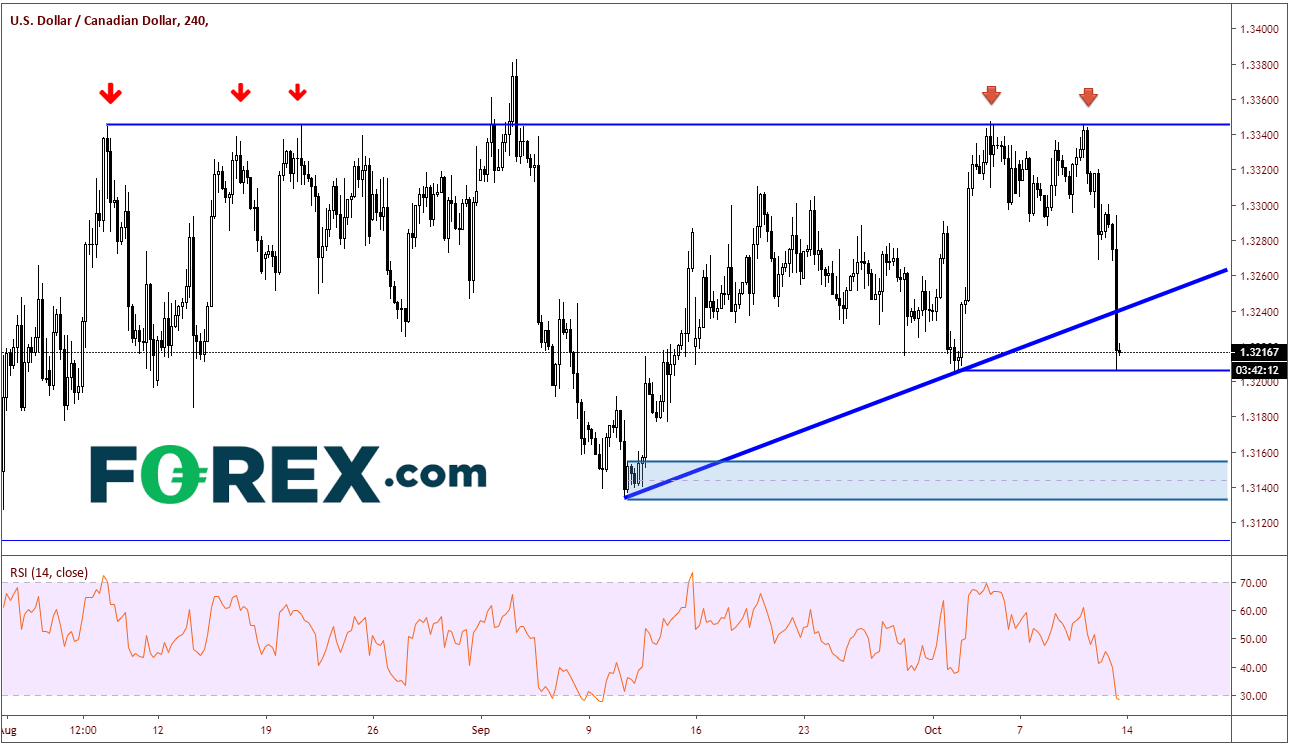
On a 240-minute chart, price failed numerous times to stay above 1.3350, and upon release of today’s employment data, spiked lower through and upward sloping trendline going back to September 10th. For the moment, USD/CAD is holding previous lows near 1.3200. Next support zone is between 1.3150 and 1.3130, prior lows from mid-September.
Source: Tradingview, FOREX.com
However, on a daily chart, we get a better picture of the horizontal support and the rising weekly trendline near that 1.3130/50 level. If price breaks through these levels, USD/CAD can push much lower towards the 1.2000/1.2300 levels over the lower term.
Source: Tradingview, FOREX.com
Resistance comes in above at the break of the trendline near 1.3240 and above that near prior lows (which now act as resistance) near 1.3270.
Related tags:
Latest market news




The complete CFD trading experience
Award-winning platforms, competitive spreads, low commissions and dedicated support.
We live and breathe the markets and are dedicated to helping traders realise their ambitions as we continue to set the industry bar.
Economic calendar
Web Trader platform
Our sophisticated web-based platform is packed with features.
Related articles
RBA delivers 25bp hike, Bullock now the main event
The RBA delivered the expected 25bp hike, but Bullock’s press conference now looms as the bigger volatility risk for AUD/USD and the ASX 200.
EUR/USD, USD/JPY Outlook: Oil, yields and an FX identity crisis
Crude oil is setting the tone across rates and FX, leaving EUR/USD vulnerable and USD/JPY caught between higher Treasury yields and the growing threat of intervention
AUD/USD Analysis: What's Next for the Australian Dollar After the RBA Decision?
Recent trading sessions have reflected a more neutral tone around the Australian dollar. This can be seen in AUD/USD price action, which has posted moves of roughly 0.2% over the last two sessions without establishing a clear direction. Much of this lack of momentum is linked to expectations surrounding the next policy moves from both the Reserve Bank of Australia (RBA) and the Federal Reserve.

StoneX Europe Ltd may make third party material available on this website which may contain information included but not limited to the conditions of financial markets. The material is for information purposes only and does not contain, and should not be construed as containing, investment advice and/or investment recommendation and/or an investment research and/or an offer of or solicitation for any transactions in financial instruments; any decision to enter into a specific transaction shall be made by the client following an assessment by him/her of their situation.
StoneX Europe Ltd makes no representation or warranty and assumes no liability as to the accuracy or completeness of the information provided, nor any loss arising from any investment based on a recommendation, forecast or other information supplied. You should always seek independent advice as to your suitability to speculate in any related markets and your ability to assume the associated risks, if you are at all unsure. We are not under any obligation to update any such material. Any opinion made may be personal to the author and may not reflect the opinion of StoneX Europe Ltd.