





Canadian Dollar Forecast: USD/CAD Falls amid Sticky Canada Inflation
USD/CAD attempts to extend the decline from the start of the week as Canada’s CPI prints at 1.7% in April versus forecasts for a 1.6% reading.
Share this:

Canadian Dollar Outlook: USD/CAD
USD/CAD may threaten the range bound price action carried over from last week as Canada’s Consumer Price Index (CPI) warns of sticky inflation.
Canadian Dollar Forecast: USD/CAD Falls amid Sticky Canada Inflation
USD/CAD attempts to extend the decline from the start of the week as Canada’s CPI prints at 1.7% in April versus forecasts for a 1.6% reading, with the core rate of inflation widening to 2.5% from 2.2% per annum in March.
According to Statistics Canada, ‘moderating the slowdown in the CPI in April were higher prices for travel tours (+6.7%) and food purchased from stores (+3.8%),’ and it remains to be seen if the rise in US tariffs will force a response from the Bank of Canada (BoC) as the central bank appears to be at or nearing the end of its rate-cutting cycle.
Join David Song for the Weekly Fundamental Market Outlook webinar.
David provides a market overview and takes questions in real-time. Register Here
Recent remarks from the BoC suggest the central bank will stick to a wait-and-see approach as the ‘Governing Council will proceed carefully, with particular attention to the risks and uncertainties facing the Canadian economy,’ and USD/CAD may give back the rebound from the monthly low (1.3751) as signs of higher price growth curbs speculation for a BoC rate cut.
With that said, USD/CAD may respond to the negative slope in the 50-Day SMA (1.4055) should it continue to hold below the moving average, but the ongoing transition in US fiscal policy may lead to a shift in US Dollar sentiment as the Trump administration avoids a trade war.
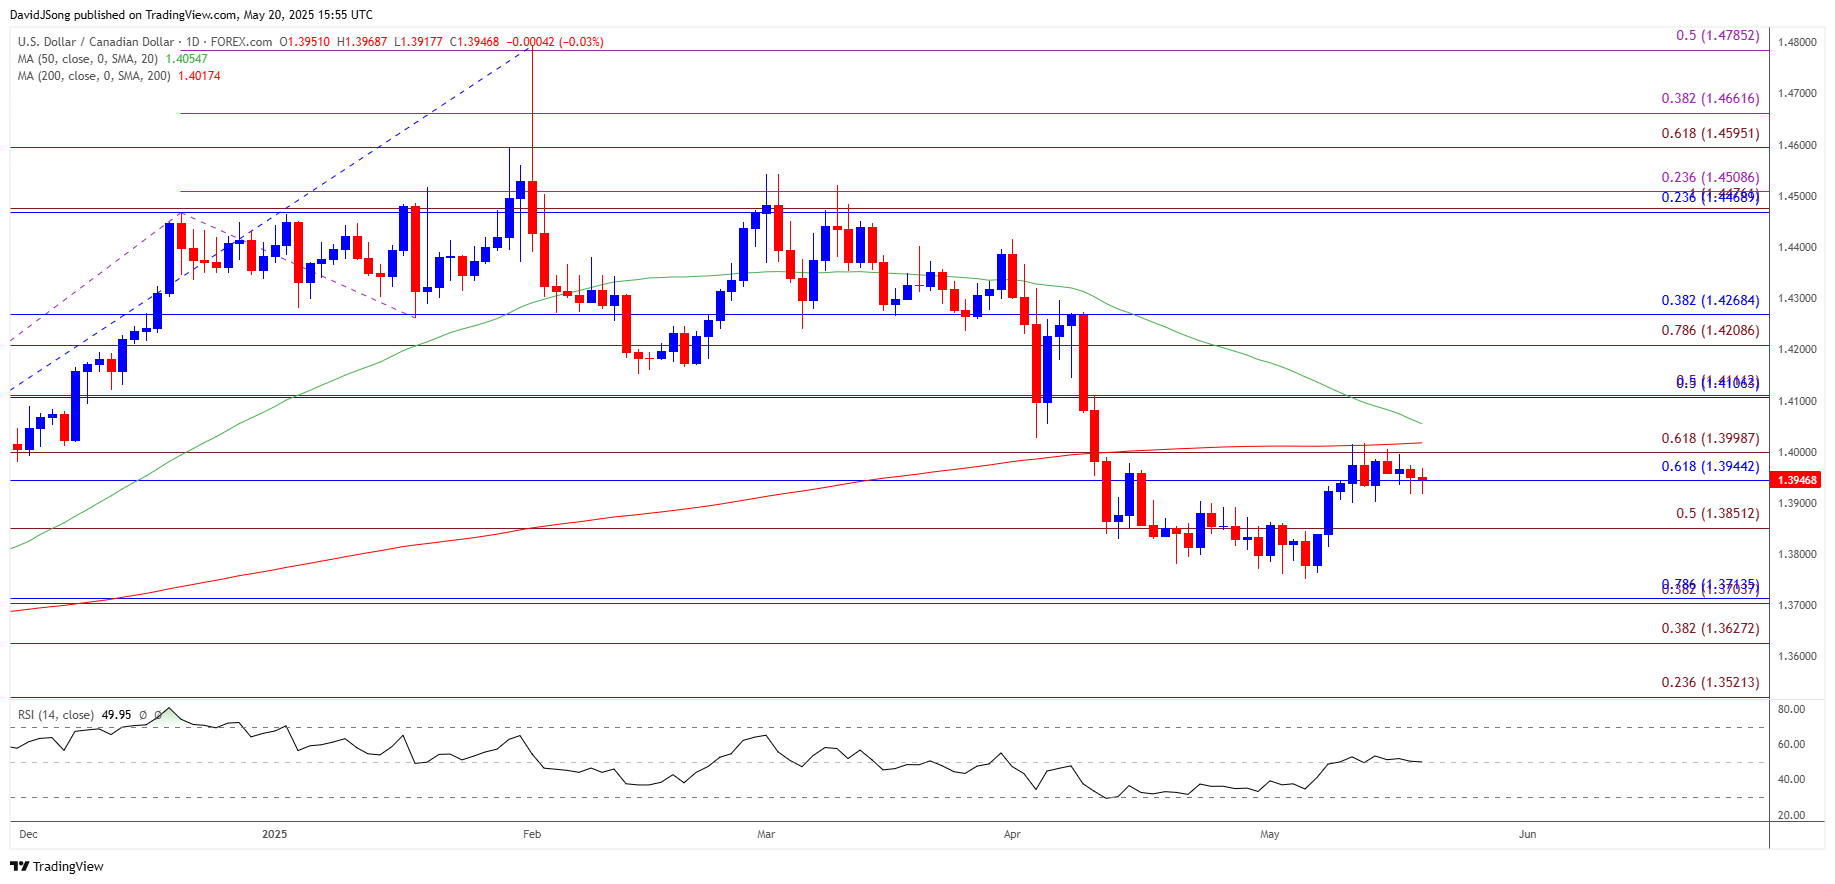
USD/CAD Price Chart – Daily
Chart Prepared by David Song, Senior Strategist; USD/CAD Price on TradingView
- USD/CAD seems to be stuck in a narrow range following the failed attempts to close above the 1.3940 (61.8% Fibonacci retracement) to 1.4000 (61.8% Fibonacci extension) zone, but lack of momentum to hold above the last week’s low (1.3900) may push the exchange rate toward 1.3850 (50% Fibonacci extension).
- A breach of the monthly low (1.3751) opens up the 1.3700 (38.2% Fibonacci extension) to 1.3710 (78.6% Fibonacci retracement) region, with the next area of interest coming in around 1.3630 (38.2% Fibonacci extension).
- At the same time, a close above the 1.3940 (61.8% Fibonacci retracement) to 1.4000 (61.8% Fibonacci extension) zone may push USD/CAD toward 1.4110 (50% Fibonacci retracement), with the next area of interest coming in around 1.4210 (78.6% Fibonacci extension) to 1.4270 (38.2% Fibonacci retracement).
Additional Market Outlooks
Australian Dollar Forecast: AUD/USD Vulnerable to RBA Rate Cut
USD/JPY Decline Persists amid US Credit Rating Downgrade
Gold Price Struggles to Close Below 50-Day SMA
GBP/USD Defends Rebound from Weekly Low to Hold Above 50-Day SMA
--- Written by David Song, Senior Strategist
Follow on Twitter at @DavidJSong
Related tags:




The complete CFD trading experience
Award-winning platforms, competitive spreads, low commissions and dedicated support.
We live and breathe the markets and are dedicated to helping traders realise their ambitions as we continue to set the industry bar.
Economic calendar
Web Trader platform
Our sophisticated web-based platform is packed with features.
Related articles

DAX Climbs After Fed Move, Eyes Break Above 26,000 Resistance
The DAX has opened significantly higher following the Federal Reserve's delivery of its first interest rate hike since 2023. Although the Fed signaled further tightening, the market reaction was surprisingly positive, as much of the hawkish expectation had already been priced in. Attention now shifts to the 25,900–26,000 point range, which will likely determine whether the current recovery evolves into a new upward wave or remains merely a short-covering rally.


Crude Oil Price Outlook: WTI and Brent Lead the Market Narrative
Crude Oil Price Outlook: Crude oil remains the market’s dominant narrative despite conflicting headline signals


Dow Jones Breaks Support as Oil and Yields Hit Stocks
Dow Jones weakness links rising crude oil and Treasury yields with pressure on stocks, while a rebound leaves the broken uptrend unconfirmed.
StoneX Europe Ltd may make third party material available on this website which may contain information included but not limited to the conditions of financial markets. The material is for information purposes only and does not contain, and should not be construed as containing, investment advice and/or investment recommendation and/or an investment research and/or an offer of or solicitation for any transactions in financial instruments; any decision to enter into a specific transaction shall be made by the client following an assessment by him/her of their situation.
StoneX Europe Ltd makes no representation or warranty and assumes no liability as to the accuracy or completeness of the information provided, nor any loss arising from any investment based on a recommendation, forecast or other information supplied. You should always seek independent advice as to your suitability to speculate in any related markets and your ability to assume the associated risks, if you are at all unsure. We are not under any obligation to update any such material. Any opinion made may be personal to the author and may not reflect the opinion of StoneX Europe Ltd.