




Chinese yuan, stocks and commodities slump
Just when you thought the c-word was no more a thing for the markets…
Share this:

Well, here we are, more than 2 years into the pandemic and Covid is still roiling financial markets. Concerns about demand have intensified after Beijing locked down parts of Chaoyang District as the virus spread there. This triggered panic as people had hoped that lockdowns would ease in Shanghai rather than more restrictions being imposed elsewhere. But now the prospects of the capital city being put into a full lockdown has unnerved investors worldwide. Not only does this imply weaker demand from China, but it could reignite supply chain woes, further exacerbating inflationary pressures.
The Chinese yuan has fallen for the fifth day in a row, this time by more than 1%, lifting the USD/CNH to its highest level since November 2020. The Aussie and other commodity dollars have followed suit. Chinese equities dropped more than 5% overnight, with European and US futures also feeling the pain. Crude oil, copper and other metals all fell on demand concerns.
So, while the rest of the world’s largest economy are tightening belts, it looks like China might have to loosen its policy in order to keep its economy ticking over at the target rate in the second quarter. A couple of months ago, China set an economic growth target for the year of around 5.5%. This was the lowest level in more than a quarter-century of economic planning. But in light of the recent lockdowns, it might struggle to even achieve that target.
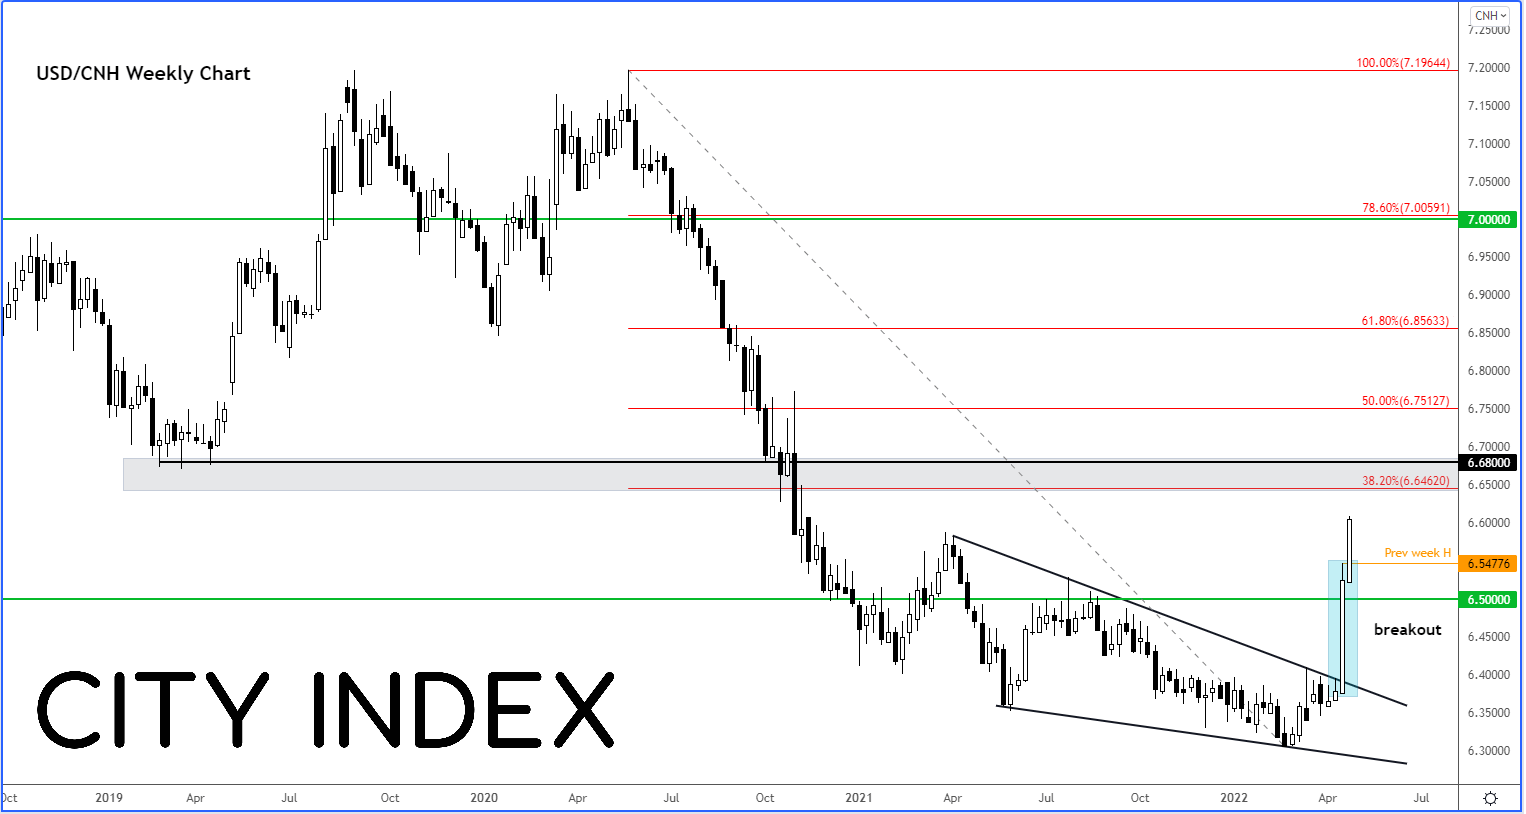
Indeed, fears over the Chinese economy saw the USD/CNH break out from a consolidation pattern last week, leading a big upsurge and follow-up technical buying in this pair (or selling in the yuan):
Source: StoneX and TradingView
For as long as the USD/CNH now remains above last week’s high at 6.5477, the short-term path of least resistance would be to the upside, meaning more weakness is likely for the yuan. From here, a move to the shaded region on the chart between 6.65 to 6.70 looks quite likely. Here, the 38.2% Fibonacci level meets prior support-turned-resistance area. I wouldn’t be surprised if this region were to offer only mild resistance, before the rally continues given expectations that monetary policy of the US will further diverge from that of China.
Well, here we are, more than 2 years into the pandemic and Covid is still roiling financial markets. Concerns about demand have intensified after Beijing locked down parts of Chaoyang District as the virus spread there. This triggered panic as people had hoped that lockdowns would ease in Shanghai rather than more restrictions being imposed elsewhere. But now the prospects of the capital city being put into a full lockdown has unnerved investors worldwide. Not only does this imply weaker demand from China, but it could reignite supply chain woes, further exacerbating inflationary pressures.
The Chinese yuan has fallen for the fifth day in a row, this time by more than 1%, lifting the USD/CNH to its highest level since November 2020. The Aussie and other commodity dollars have followed suit. Chinese equities dropped more than 5% overnight, with European and US futures also feeling the pain. Crude oil, copper and other metals all fell on demand concerns.
So, while the rest of the world’s largest economy are tightening belts, it looks like China might have to loosen its policy in order to keep its economy ticking over at the target rate in the second quarter. A couple of months ago, China set an economic growth target for the year of around 5.5%. This was the lowest level in more than a quarter-century of economic planning. But in light of the recent lockdowns, it might struggle to even achieve that target.
Indeed, fears over the Chinese economy saw the USD/CNH break out from a consolidation pattern last week, leading a big upsurge and follow-up technical buying in this pair (or selling in the yuan):
For as long as the USD/CNH now remains above last week’s high at 6.5477, the short-term path of least resistance would be to the upside, meaning more weakness is likely for the yuan. From here, a move to the shaded region on the chart between 6.65 to 6.70 looks quite likely. Here, the 38.2% Fibonacci level meets prior support-turned-resistance area. I wouldn’t be surprised if this region were to offer only mild resistance, before the rally continues given expectations that monetary policy of the US will further diverge from that of China.
How to trade with City Index
You can trade with City Index by following these four easy steps:
- Open an account, or log in if you’re already a customer
• Open an account in the UK
• Open an account in Australia
• Open an account in Singapore
- Search for the company you want to trade in our award-winning platform
- Choose your position and size, and your stop and limit levels
- Place the trade
Related tags:
Latest market news




The complete CFD trading experience
Award-winning platforms, competitive spreads, low commissions and dedicated support.
We live and breathe the markets and are dedicated to helping traders realise their ambitions as we continue to set the industry bar.
Economic calendar
Web Trader platform
Our sophisticated web-based platform is packed with features.
Related articles
USD/JPY Forecast: Is Rising Japanese Inflation Supporting the Yen?
As the trading week comes to an end, one of the most relevant developments in the FX market has been the renewed strength of the Japanese yen. This can be seen in the recent performance of USD/JPY, which has fallen nearly 1.0% over the last two trading sessions, highlighting a meaningful recovery in the Japanese currency against the U.S. dollar.
Australian Dollar Forecast: AUD/USD Support Reversal Sparks Monthly Range Breakout 10 23 2026
A sharp reversal off key support has fueled the AUD/USD recovery, with resistance now in focus ahead of next week’s Fed decision and Australian CPI.


USD/JPY, Nikkei Break Lower as AI Meltdown Spreads
Thursday’s tech tantrum has become Friday’s fire sale. With Nikkei support giving way and the yen strengthening, could the selling start feeding on itself?

StoneX Europe Ltd may make third party material available on this website which may contain information included but not limited to the conditions of financial markets. The material is for information purposes only and does not contain, and should not be construed as containing, investment advice and/or investment recommendation and/or an investment research and/or an offer of or solicitation for any transactions in financial instruments; any decision to enter into a specific transaction shall be made by the client following an assessment by him/her of their situation.
StoneX Europe Ltd makes no representation or warranty and assumes no liability as to the accuracy or completeness of the information provided, nor any loss arising from any investment based on a recommendation, forecast or other information supplied. You should always seek independent advice as to your suitability to speculate in any related markets and your ability to assume the associated risks, if you are at all unsure. We are not under any obligation to update any such material. Any opinion made may be personal to the author and may not reflect the opinion of StoneX Europe Ltd.