



Copper forecast: risk-off mood and demand worries sink prices below $6
Copper has broken below $6, its 200-day moving average and a trend line dating back to August 2025. With industrial metals under pressure and the dollar firm, $5.50 is now the level to watch.
Share this:

Copper prices have sunk some 5.5% as a risk-off mood and worries over demand trigger a sharper sell-off than in precious metals. The base metal has broken a long-term trend line in place since August 2025 and taken out its 200-day moving average, with the 21-day exponential now turning lower. Until the former $6 floor is reclaimed, the near-term copper forecast is tilted to the downside.
- Copper has fallen below $6, breaking a trend line in place since August 2025 and its 200-day moving average.
- Weakness across industrial metals, led by iron ore, reflects both demand concerns and supply dynamics.
- With $5.50 the next support and $6 now resistance, the near-term copper forecast is tilted to the downside.
Watch the Full Video
Risk-off mood hits copper hardest
Copper has taken a bigger plunge than gold or silver today, reflecting the risk-off tone across financial markets. European equity markets have slipped deeper into the red, while US indices have fallen from their early highs. Nvidia's strong third-quarter results have so far failed to provide any support for US markets either, and copper has borne the brunt of the selling.
Industrial metals slump on demand and supply concerns
The weakness is not confined to copper. Industrial metals have come under renewed pressure, particularly iron ore, while copper is rolling over along with precious metals. Both demand concerns and supply dynamics appear to be contributing to the decline.
That matters beyond the metals market itself. Sustained pressure on industrial metals typically weighs on currencies such as the Australian dollar and South African rand, and to a lesser extent the New Zealand dollar. Weaker commodity currencies, in turn, provide another source of support for the US dollar, which is hardly helpful for dollar-priced metals.
A hawkish Fed is the main reason for metals' weakness
The dollar has been going from strength to strength. Markets have been reassessing the Federal Reserve's policy outlook for more than a week, and Christopher Waller's comments last Tuesday brought the prospect of a prolonged tightening cycle into sharper focus. Upside inflation surprises and resilient US activity have since reinforced expectations that interest rates could stay higher for longer. The greenback is starting to look stretched, however, and a pullback could offer copper some relief.
Technical copper forecast and key levels to watch
From a technical analysis point of view, the copper forecast has taken a decidedly weaker turn. Prices have broken a long-term trend line that had been in place since August 2025 and taken out the 200-day moving average, which had been a key support. The 21-day exponential is now turning lower, which is hardly surprising.
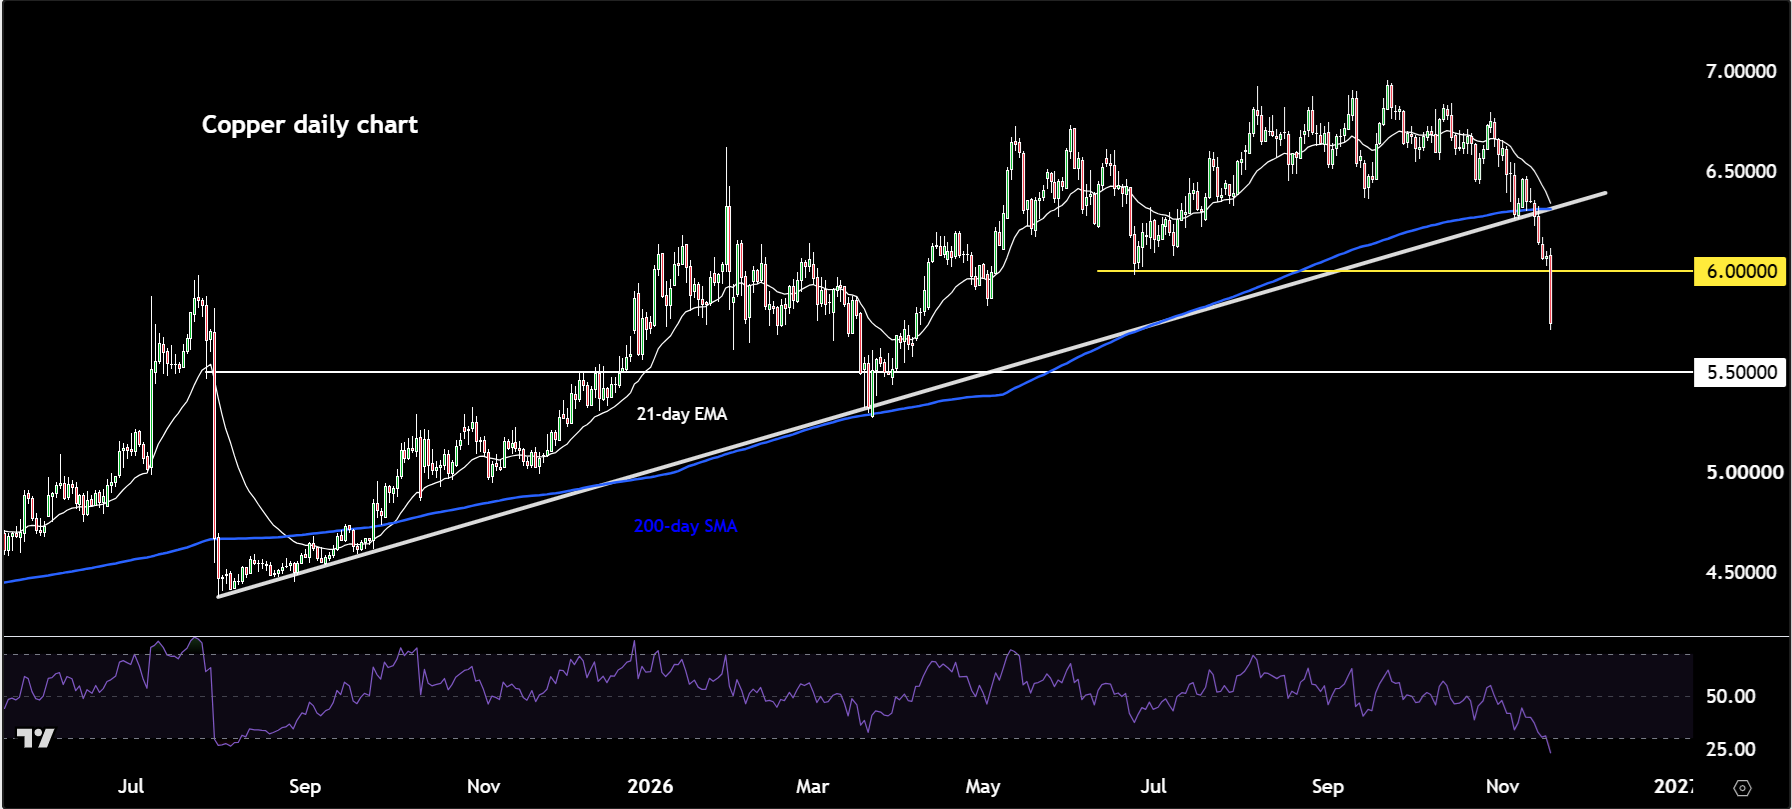
Key support comes in around $5.50, where the rally began at the end of March, ending the previous downswing. Given how oversold the base metal is, that area could deliver a bounce of some sort. Break below it, and a return to $5.00 could be on the cards, although that is some distance away from current levels. Resistance meanwhile comes in at $6.00, which was previously support. Whether that level now turns into resistance is the key question.
Frequently Asked Questions
Why are copper prices falling?
Copper is falling on a risk-off mood across equity markets, concerns over demand and broader weakness in industrial metals such as iron ore. A strong US dollar has added to the pressure.
Where is support for copper?
The next support comes in around $5.50, where the rally began at the end of March. Below that, $5.00 could come into view.
Is copper oversold?
Yes, copper looks oversold after its latest plunge, which raises the prospect of a bounce around $5.50. However, the broken trend line and 200-day moving average suggest the trend has turned lower.
-- Written by Fawad Razaqzada, Market Analyst | Follow Fawad on Twitter @Trader_F_R
Related tags:
Latest market news



The complete CFD trading experience
Award-winning platforms, competitive spreads, low commissions and dedicated support.
We live and breathe the markets and are dedicated to helping traders realise their ambitions as we continue to set the industry bar.
Economic calendar
Web Trader platform
Our sophisticated web-based platform is packed with features.
Related articles
Euro Short-term Outlook: EUR/USD Plunges to 19-Month Low—Bears Face Critical Test 11 18 2026
The Euro selloff is now approaching pivotal support, raising the prospect of downside exhaustion as the November decline extends.

Copper forecast: risk-off mood and demand worries sink prices below $6
Copper has broken below $6, its 200-day moving average and a trend line dating back to August 2025. With industrial metals under pressure and the dollar firm, $5.50 is now the level to watch.
Silver Analysis: XAG/USD Continues to Set New Lows for the Year
It continues to be a challenging period for the silver market in the short term, as the precious metal remains under pressure and keeps posting new lows on a consistent basis. Over the last five trading sessions alone, silver has fallen nearly 12%, a move that has highlighted a strong bearish bias not seen in the market for several months.

StoneX Europe Ltd may make third party material available on this website which may contain information included but not limited to the conditions of financial markets. The material is for information purposes only and does not contain, and should not be construed as containing, investment advice and/or investment recommendation and/or an investment research and/or an offer of or solicitation for any transactions in financial instruments; any decision to enter into a specific transaction shall be made by the client following an assessment by him/her of their situation.
StoneX Europe Ltd makes no representation or warranty and assumes no liability as to the accuracy or completeness of the information provided, nor any loss arising from any investment based on a recommendation, forecast or other information supplied. You should always seek independent advice as to your suitability to speculate in any related markets and your ability to assume the associated risks, if you are at all unsure. We are not under any obligation to update any such material. Any opinion made may be personal to the author and may not reflect the opinion of StoneX Europe Ltd.