



COT Report Highlights From 24 June 2025
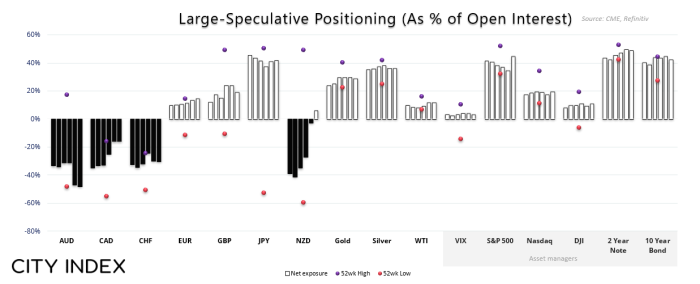
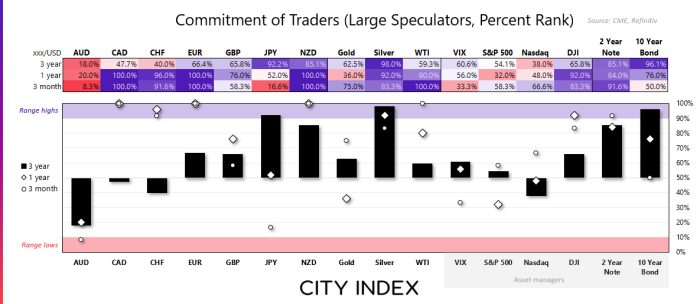
Traders ramped up bearish bets on the USD while the NZD flipped net-long for the first time since October, COT data shows.
Share this:

Weekly Market Positioning Overview – COT Report Highlights (24 June 2025)
• US Dollar (USD): Traders were effectively net-short the US dollar by $21 billion last week (a 5-year high)
• European dollar (EUR): Large speculators increased net-long exposure by 9.6k contracts, with longs rising 1.3% (2.9k contracts) and shorts falling by -5.5% (-6.6k contracts)
• British pound (GBP): Net-long exposure declined by -8.5k contracts, with gross-longs falling -6.1% (-6.4k contracts) and shorts rising 3.2% (2k contracts)
• Japanese yen (JPY): Net-long exposure was effectively flat at 132.3k contracts long
• Australian dollar (AUD): Net-short exposure rose by 3.2k contracts, though gross-longs rise by -9% (2k contracts) and shorts increased by (5.8%) 5.2k contracts
• Canadian dollar (CAD): Gross-shorts fell by -17% (-16.1k contracts), making it the third consecutive week of short covering form CAD bears
• Swiss franc (CHF): Net-short exposure increased by ~10k contracts between large speculators and asset managers
• New Zealand dollar (NZD): Flipped to net-long exposure for the first time since October and to an 11-month high, with gross-longs rising 27% (4k contracts)
• Gold (GC): Net-log exposure fell by -5.4k contracts, with gross-shorts rising by 4.2% (1.6k contracts)
• Silver (SI): Net-long exposure by down by -4.3k contracts, though speculative volumes were lower with longs falling -5.1% and shorts down -1.3%
• Crude Oil (WTI): Managed funds actually reduced their net-long exposure to crude oil by -.1k contracts last week, ahead of the large selloff
View the full economic calendar
View the full economic calendar
-- Written by Matt Simpson
Follow Matt on Twitter @cLeverEdge
How to trade with City Index
You can trade with City Index by following these four easy steps:
- Open an account, or log in if you’re already a customer
• Open an account in the UK
• Open an account in Australia
• Open an account in Singapore
- Search for the market you want to trade in our award-winning platform
- Choose your position and size, and your stop and limit levels
- Place the trade
Related tags:
Latest market news




The complete CFD trading experience
Award-winning platforms, competitive spreads, low commissions and dedicated support.
We live and breathe the markets and are dedicated to helping traders realise their ambitions as we continue to set the industry bar.
Economic calendar
Web Trader platform
Our sophisticated web-based platform is packed with features.
Related articles

USD/JPY outlook: Yen shorts flushed again as history points lower
Speculators have staged one of the largest yen positioning reversals on record, with past episodes often followed by further USD/JPY weakness.

FX Futures Positioning: Yen, Euro Bears Caught Short | COT report
Euro and yen bears were caught offside after the FOMC and coordinated US-Japan intervention, while US dollar positioning reached an 11-year extreme.

Gold Slips as Crude Oil Surges on Middle East Tensions
Gold weakens despite geopolitical risks as crude oil volatility surges on Middle East tensions. Traders watch $5,000 support on gold and $100 for Brent.
StoneX Europe Ltd may make third party material available on this website which may contain information included but not limited to the conditions of financial markets. The material is for information purposes only and does not contain, and should not be construed as containing, investment advice and/or investment recommendation and/or an investment research and/or an offer of or solicitation for any transactions in financial instruments; any decision to enter into a specific transaction shall be made by the client following an assessment by him/her of their situation.
StoneX Europe Ltd makes no representation or warranty and assumes no liability as to the accuracy or completeness of the information provided, nor any loss arising from any investment based on a recommendation, forecast or other information supplied. You should always seek independent advice as to your suitability to speculate in any related markets and your ability to assume the associated risks, if you are at all unsure. We are not under any obligation to update any such material. Any opinion made may be personal to the author and may not reflect the opinion of StoneX Europe Ltd.